|
Download Data (XLS File) |
|
||||||||
|
||||||||
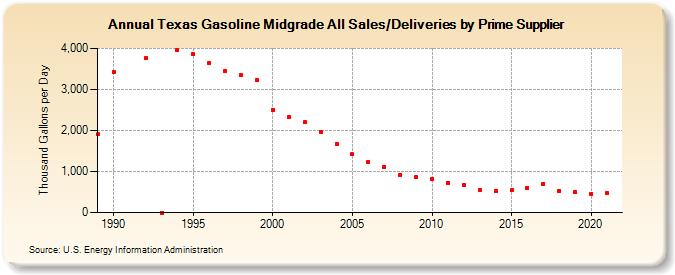
| Texas Gasoline Midgrade All Sales/Deliveries by Prime Supplier (Thousand Gallons per Day) | ||||||||
| Decade | Year-0 | Year-1 | Year-2 | Year-3 | Year-4 | Year-5 | Year-6 | Year-7 | Year-8 | Year-9 |
|---|---|---|---|---|---|---|---|---|---|---|
| 1980's | 1,905.6 | |||||||||
| 1990's | 3,426.2 | W | 3,754.7 | 0.0 | 3,960.4 | 3,853.0 | 3,641.2 | 3,447.9 | 3,357.7 | 3,224.4 |
| 2000's | 2,505.2 | 2,316.8 | 2,198.3 | 1,971.8 | 1,672.2 | 1,417.5 | 1,235.7 | 1,121.5 | 923.9 | 863.5 |
| 2010's | 822.1 | 730.2 | 666.8 | 561.5 | 519.5 | 551.3 | 605.0 | 702.9 | 535.4 | 503.7 |
| 2020's | 459.9 |
| - = No Data Reported; -- = Not Applicable; NA = Not Available; W = Withheld to avoid disclosure of individual company data. |
| Release Date: 6/1/2022 |
| Next Release Date: TBD |