|
Download Data (XLS File) |
|
||||||||
|
||||||||
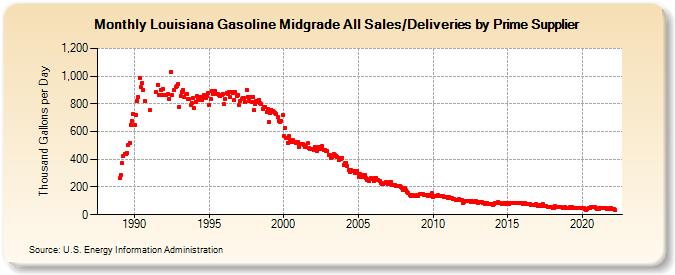
| Louisiana Gasoline Midgrade All Sales/Deliveries by Prime Supplier (Thousand Gallons per Day) | ||||||||
| Year | Jan | Feb | Mar | Apr | May | Jun | Jul | Aug | Sep | Oct | Nov | Dec |
|---|---|---|---|---|---|---|---|---|---|---|---|---|
| 1988 | NA | NA | NA | NA | NA | NA | NA | NA | NA | NA | NA | NA |
| 1989 | 262.9 | 289.7 | 374.9 | 420.1 | 438.9 | 440.8 | 447.1 | 503.8 | 519.4 | 650.2 | 675.2 | 726.5 |
| 1990 | 648.1 | 719.3 | 821.4 | 846.3 | 988.0 | 919.1 | 950.0 | 902.0 | 819.4 | W | W | W |
| 1991 | 753.1 | W | W | W | W | 883.7 | W | 939.2 | 867.3 | 902.0 | 867.1 | 904.7 |
| 1992 | 866.3 | 862.5 | W | 870.4 | 836.1 | 1,031.2 | 863.0 | W | 898.0 | 923.1 | 931.8 | 941.2 |
| 1993 | 779.4 | 853.8 | 888.1 | 899.2 | 851.6 | 868.0 | 867.6 | 832.9 | 831.4 | 788.1 | 805.2 | 841.5 |
| 1994 | 766.5 | 814.4 | 855.4 | 828.8 | 850.8 | 848.2 | 826.6 | 848.0 | 863.3 | 839.3 | 855.3 | 877.5 |
| 1995 | 793.1 | 835.9 | 891.8 | 870.7 | 884.5 | 891.4 | 874.4 | 873.5 | 867.3 | 859.2 | 865.3 | 868.0 |
| 1996 | 796.7 | 838.4 | 880.3 | 869.4 | 886.9 | 847.0 | 885.3 | 876.6 | 827.4 | 883.7 | 856.3 | 863.7 |
| 1997 | 788.3 | 820.3 | 833.8 | 844.6 | 845.0 | 810.1 | 902.2 | 851.6 | 823.9 | 851.5 | 811.5 | 851.2 |
| 1998 | 753.1 | 796.9 | 818.3 | 816.6 | 827.0 | 804.2 | 795.8 | 763.1 | 778.7 | 780.0 | 737.6 | 765.1 |
| 1999 | 668.2 | 731.1 | 759.0 | 751.6 | 739.6 | 735.5 | 723.7 | 706.1 | 679.6 | 671.2 | 677.7 | 720.6 |
| 2000 | 567.9 | 628.0 | 554.3 | 518.0 | 564.9 | 542.3 | 524.7 | 536.0 | 521.4 | 527.5 | 515.8 | 525.3 |
| 2001 | 490.6 | 508.0 | 513.6 | 509.8 | 505.5 | 486.1 | 485.6 | 515.5 | 478.6 | 476.5 | 473.1 | 477.4 |
| 2002 | 467.1 | 490.1 | 479.5 | 463.0 | 488.3 | 477.0 | 474.5 | 493.4 | 463.3 | 468.8 | 459.8 | 462.4 |
| 2003 | 434.3 | 430.3 | 406.7 | 412.8 | 441.6 | 427.7 | 426.2 | 417.9 | 391.7 | 406.1 | 398.8 | 412.5 |
| 2004 | 359.8 | 370.4 | 374.8 | 354.7 | 319.5 | 306.0 | 319.7 | 315.7 | 318.6 | 302.3 | 298.5 | 315.3 |
| 2005 | 274.0 | 293.6 | 290.1 | 274.6 | 284.1 | 288.1 | 267.2 | 253.4 | 245.0 | 260.3 | 265.4 | 257.0 |
| 2006 | 243.1 | 267.4 | 265.5 | 253.7 | 248.9 | 245.1 | 229.2 | 225.1 | 220.2 | 228.5 | 233.5 | 232.3 |
| 2007 | 221.7 | 235.3 | 236.0 | 216.1 | 217.9 | 212.4 | 206.8 | 210.0 | 204.1 | 206.3 | 198.5 | 190.5 |
| 2008 | 178.9 | 192.6 | 176.0 | 165.0 | 157.0 | 142.1 | 134.1 | 140.2 | 140.2 | 136.0 | 136.4 | 144.5 |
| 2009 | 135.0 | 148.5 | 149.2 | 146.1 | 147.0 | 144.7 | 141.9 | 139.4 | 135.8 | 138.7 | 136.8 | 153.6 |
| 2010 | 125.5 | 134.9 | 138.1 | 137.7 | 139.8 | 137.9 | 135.4 | 134.0 | 133.2 | 129.9 | 130.1 | 127.4 |
| 2011 | 117.0 | 125.6 | 120.4 | 118.6 | 113.2 | 112.8 | 109.0 | 108.7 | 106.5 | 110.0 | 106.9 | 105.0 |
| 2012 | 88.1 | 93.9 | 99.3 | 98.3 | 99.7 | 99.9 | 92.3 | 97.9 | 90.3 | 92.5 | 101.3 | 91.0 |
| 2013 | 84.6 | 89.2 | 94.3 | 92.0 | 86.2 | 85.1 | 79.2 | 83.3 | 79.8 | 78.5 | 80.6 | 80.3 |
| 2014 | 71.2 | 79.9 | 81.9 | 83.6 | 91.5 | 81.5 | 83.2 | 80.8 | 80.7 | 81.5 | 80.3 | 81.7 |
| 2015 | 76.7 | 79.8 | 82.6 | 81.5 | 82.0 | 82.2 | 86.8 | 86.5 | 84.6 | 82.0 | 81.3 | 85.6 |
| 2016 | 78.2 | 82.0 | 82.3 | 77.6 | 76.7 | 75.6 | 76.3 | 71.9 | 73.2 | 73.1 | 73.5 | 73.7 |
| 2017 | 62.5 | 64.6 | 67.0 | 63.5 | 74.8 | 64.2 | 63.5 | 62.0 | 55.6 | 54.8 | 55.9 | 55.7 |
| 2018 | 49.4 | 51.8 | 60.3 | 54.8 | 56.5 | 56.3 | 53.7 | 54.5 | 49.2 | 51.5 | 53.9 | 51.0 |
| 2019 | 48.3 | 49.6 | 52.6 | 50.9 | 52.1 | 50.1 | 48.9 | 49.9 | 47.0 | 46.3 | 47.5 | 47.2 |
| 2020 | 45.5 | 45.8 | 43.5 | 34.0 | 41.9 | 47.7 | 49.6 | 56.1 | 54.6 | 57.1 | 54.7 | 48.6 |
| 2021 | 43.3 | 40.2 | 48.1 | 48.8 | 49.6 | 48.8 | 50.0 | 46.5 | 40.0 | 44.5 | 44.9 | 44.9 |
| 2022 | 39.5 | 41.8 | 33.4 | |||||||||
| - = No Data Reported; -- = Not Applicable; NA = Not Available; W = Withheld to avoid disclosure of individual company data. |
| Release Date: 5/19/2022 |
| Next Release Date: TBD |