|
Download Data (XLS File) |
|
||||||||
|
||||||||
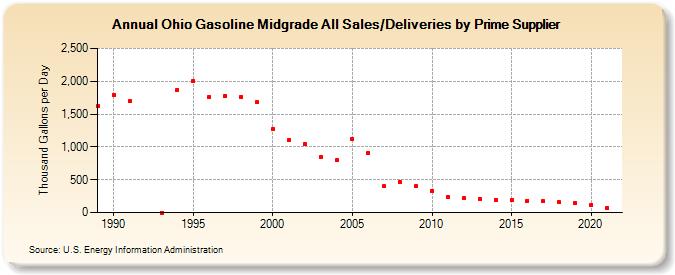
| Ohio Gasoline Midgrade All Sales/Deliveries by Prime Supplier (Thousand Gallons per Day) | ||||||||
| Decade | Year-0 | Year-1 | Year-2 | Year-3 | Year-4 | Year-5 | Year-6 | Year-7 | Year-8 | Year-9 |
|---|---|---|---|---|---|---|---|---|---|---|
| 1980's | 1,621.3 | |||||||||
| 1990's | 1,796.1 | 1,693.0 | W | 0.0 | 1,866.6 | 2,002.0 | 1,762.5 | 1,775.4 | 1,764.0 | 1,677.1 |
| 2000's | 1,274.8 | 1,099.2 | 1,042.5 | 839.3 | 792.9 | 1,118.9 | 909.3 | 397.8 | 461.7 | 404.0 |
| 2010's | 334.8 | 236.1 | 214.3 | 206.7 | 195.0 | 187.7 | 182.3 | 169.7 | 154.2 | 142.1 |
| 2020's | 121.7 |
| - = No Data Reported; -- = Not Applicable; NA = Not Available; W = Withheld to avoid disclosure of individual company data. |
| Release Date: 6/1/2022 |
| Next Release Date: TBD |