|
Download Data (XLS File) |
|
||||||||
|
||||||||
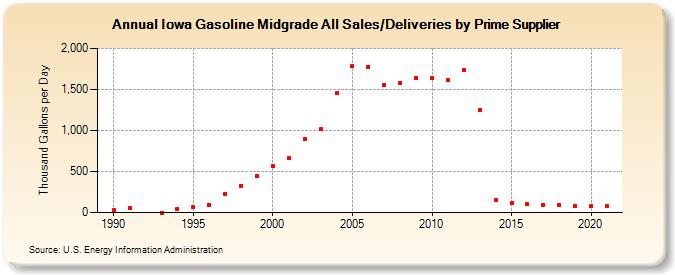
| Iowa Gasoline Midgrade All Sales/Deliveries by Prime Supplier (Thousand Gallons per Day) | ||||||||
| Decade | Year-0 | Year-1 | Year-2 | Year-3 | Year-4 | Year-5 | Year-6 | Year-7 | Year-8 | Year-9 |
|---|---|---|---|---|---|---|---|---|---|---|
| 1980's | W | |||||||||
| 1990's | 31.0 | 52.9 | W | 0.0 | 47.3 | 63.3 | 88.1 | 227.6 | 327.0 | 445.9 |
| 2000's | 568.1 | 661.4 | 898.0 | 1,013.8 | 1,453.4 | 1,784.9 | 1,778.8 | 1,552.4 | 1,583.2 | 1,644.8 |
| 2010's | 1,642.9 | 1,609.3 | 1,735.3 | 1,249.1 | 157.8 | 111.1 | 100.5 | 96.8 | 90.0 | 85.2 |
| 2020's | 76.9 |
| - = No Data Reported; -- = Not Applicable; NA = Not Available; W = Withheld to avoid disclosure of individual company data. |
| Release Date: 6/1/2022 |
| Next Release Date: TBD |