|
Download Data (XLS File) |
|
||||||||
|
||||||||
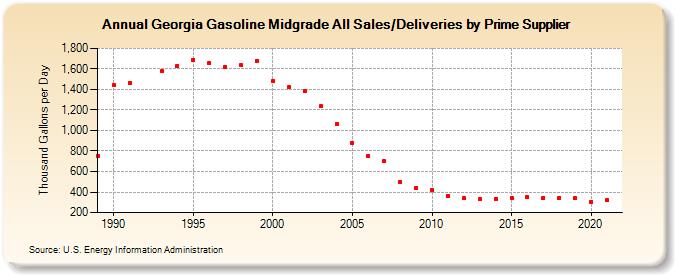
| Georgia Gasoline Midgrade All Sales/Deliveries by Prime Supplier (Thousand Gallons per Day) | ||||||||
| Decade | Year-0 | Year-1 | Year-2 | Year-3 | Year-4 | Year-5 | Year-6 | Year-7 | Year-8 | Year-9 |
|---|---|---|---|---|---|---|---|---|---|---|
| 1980's | 756.0 | |||||||||
| 1990's | 1,442.9 | 1,467.3 | W | 1,577.7 | 1,630.3 | 1,691.7 | 1,654.9 | 1,622.0 | 1,633.9 | 1,680.0 |
| 2000's | 1,482.3 | 1,421.0 | 1,384.7 | 1,234.0 | 1,062.8 | 878.3 | 753.3 | 699.0 | 502.1 | 440.2 |
| 2010's | 423.3 | 364.1 | 337.4 | 328.7 | 335.0 | 345.2 | 351.9 | 345.2 | 343.5 | 338.5 |
| 2020's | 306.2 |
| - = No Data Reported; -- = Not Applicable; NA = Not Available; W = Withheld to avoid disclosure of individual company data. |
| Release Date: 6/1/2022 |
| Next Release Date: TBD |