|
Download Data (XLS File) |
|
||||||||
|
||||||||
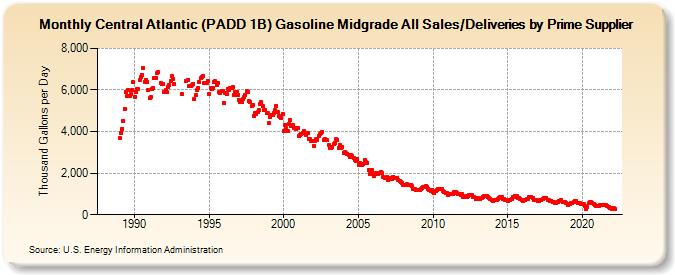
| Central Atlantic (PADD 1B) Gasoline Midgrade All Sales/Deliveries by Prime Supplier (Thousand Gallons per Day) | ||||||||
| Year | Jan | Feb | Mar | Apr | May | Jun | Jul | Aug | Sep | Oct | Nov | Dec |
|---|---|---|---|---|---|---|---|---|---|---|---|---|
| 1988 | NA | NA | NA | NA | NA | NA | NA | NA | NA | NA | NA | NA |
| 1989 | 3,695.4 | 3,911.3 | 4,143.5 | 4,527.4 | 5,094.0 | 5,898.6 | 5,690.9 | 5,991.3 | 5,721.6 | 5,782.5 | 6,012.8 | 6,360.7 |
| 1990 | 5,676.2 | 5,917.9 | 6,058.7 | 6,030.7 | 6,458.4 | 6,606.9 | 6,737.2 | 7,044.9 | 6,386.4 | 6,497.7 | 6,394.7 | 5,993.7 |
| 1991 | 5,595.5 | 5,651.9 | 6,023.7 | 6,091.7 | 6,559.9 | 6,594.3 | 6,794.2 | 6,864.8 | W | 6,327.1 | 6,305.2 | 6,310.7 |
| 1992 | 5,918.6 | 5,995.4 | 5,880.8 | 6,140.8 | 6,231.7 | 6,420.5 | 6,672.0 | 6,519.2 | 6,285.1 | W | W | W |
| 1993 | W | W | 5,802.0 | W | W | 6,435.6 | W | 6,481.7 | 6,176.5 | 6,209.9 | 6,225.4 | 6,295.1 |
| 1994 | 5,545.3 | 5,743.6 | 5,994.5 | 6,095.6 | 6,390.6 | 6,560.1 | 6,619.2 | 6,683.1 | 6,354.7 | 6,325.9 | 6,314.8 | 6,441.4 |
| 1995 | 5,827.9 | 6,099.2 | 6,068.8 | 6,077.0 | 6,360.8 | 6,422.7 | 6,244.1 | 6,325.3 | 5,926.2 | 5,845.6 | 5,961.9 | 5,970.1 |
| 1996 | 5,358.6 | 5,872.3 | 5,811.6 | 6,050.8 | 6,017.5 | 6,115.4 | 6,115.5 | 6,147.7 | 5,747.4 | 5,910.4 | 5,907.2 | 5,734.2 |
| 1997 | 5,507.0 | 5,432.1 | 5,409.2 | 5,554.9 | 5,649.1 | 5,774.8 | 5,929.0 | 5,905.8 | 5,449.4 | 5,419.5 | 5,210.7 | 5,292.6 |
| 1998 | 4,767.9 | 4,912.9 | 4,867.6 | 4,924.8 | 5,012.8 | 5,325.1 | 5,400.6 | 5,220.4 | 5,044.5 | 5,047.1 | 4,876.1 | 4,894.5 |
| 1999 | 4,421.3 | 4,684.6 | 4,812.7 | 4,796.4 | 4,898.1 | 5,014.8 | 5,230.9 | 4,934.2 | 4,741.9 | 4,702.3 | 4,647.2 | 4,866.0 |
| 2000 | 4,009.3 | 4,336.4 | 4,170.5 | 4,042.3 | 4,378.9 | 4,547.9 | 4,258.8 | 4,305.3 | 4,161.3 | 4,151.5 | 4,107.3 | 4,167.3 |
| 2001 | 3,773.7 | 3,835.4 | 3,867.8 | 3,952.0 | 4,015.1 | 3,924.9 | 3,854.2 | 3,946.4 | 3,644.2 | 3,627.5 | 3,542.7 | 3,569.0 |
| 2002 | 3,320.4 | 3,556.8 | 3,618.9 | 3,611.1 | 3,793.1 | 3,863.6 | 3,925.2 | 3,988.4 | 3,599.5 | 3,637.0 | 3,610.3 | 3,582.7 |
| 2003 | 3,344.5 | 3,229.5 | 3,193.1 | 3,239.5 | 3,391.5 | 3,440.5 | 3,619.2 | 3,588.2 | 3,226.1 | 3,341.3 | 3,223.4 | 3,272.3 |
| 2004 | 2,982.1 | 2,999.6 | 2,966.2 | 2,937.7 | 2,882.1 | 2,798.6 | 2,860.2 | 2,845.6 | 2,732.2 | 2,653.2 | 2,578.1 | 2,657.2 |
| 2005 | 2,400.7 | 2,496.3 | 2,452.1 | 2,409.6 | 2,462.1 | 2,624.2 | 2,554.6 | 2,480.5 | 2,161.2 | 1,970.8 | 2,022.6 | 2,131.1 |
| 2006 | 1,879.6 | 1,953.4 | 2,005.3 | 1,960.8 | 1,959.1 | 2,010.2 | 2,071.2 | 2,002.6 | 1,797.6 | 1,788.4 | 1,780.9 | 1,807.6 |
| 2007 | 1,660.2 | 1,760.6 | 1,744.1 | 1,717.2 | 1,828.9 | 1,789.8 | 1,773.2 | 1,782.7 | 1,668.1 | 1,635.1 | 1,562.0 | 1,525.1 |
| 2008 | 1,418.5 | 1,422.2 | 1,429.5 | 1,456.1 | 1,443.3 | 1,430.1 | 1,418.2 | 1,373.7 | 1,256.5 | 1,232.3 | 1,175.5 | 1,204.6 |
| 2009 | 1,167.1 | 1,200.0 | 1,215.0 | 1,273.4 | 1,329.8 | 1,343.2 | 1,372.5 | 1,341.8 | 1,249.7 | 1,184.0 | 1,127.2 | 1,173.6 |
| 2010 | 1,081.3 | 1,056.0 | 1,132.7 | 1,185.7 | 1,234.3 | 1,226.9 | 1,257.2 | 1,223.8 | 1,119.5 | 1,089.6 | 1,064.2 | 1,061.3 |
| 2011 | 951.9 | 982.7 | 978.3 | 1,000.8 | 998.0 | 1,073.4 | 1,103.7 | 1,053.8 | 983.0 | 979.7 | 965.4 | 1,006.4 |
| 2012 | 838.5 | 869.5 | 887.5 | 868.0 | 901.7 | 947.0 | 966.8 | 962.4 | 866.3 | 852.7 | 732.1 | 799.8 |
| 2013 | 811.9 | 762.9 | 771.1 | 785.3 | 859.0 | 892.5 | 910.7 | 891.6 | 832.7 | 780.7 | 757.5 | 719.7 |
| 2014 | 668.1 | 690.0 | 707.6 | 730.8 | 779.3 | 793.2 | 836.9 | 850.0 | 770.8 | 764.8 | 702.1 | 686.4 |
| 2015 | 654.2 | 728.4 | 718.1 | 758.4 | 843.1 | 850.2 | 910.7 | 892.7 | 819.4 | 792.8 | 737.7 | 722.5 |
| 2016 | 681.9 | 685.4 | 725.6 | 752.6 | 779.7 | 857.8 | 864.2 | 838.5 | 795.6 | 726.8 | 717.2 | 707.9 |
| 2017 | 642.8 | 656.3 | 686.6 | 696.0 | 742.9 | 817.8 | 807.9 | 813.2 | 715.9 | 701.3 | 667.2 | 665.6 |
| 2018 | 604.8 | 612.3 | 566.8 | 578.1 | 633.0 | 668.2 | 676.1 | 690.6 | 629.4 | 614.4 | 607.7 | 578.5 |
| 2019 | 491.3 | 502.1 | 513.9 | 556.2 | 576.9 | 601.3 | 666.2 | 652.3 | 576.9 | 563.0 | 541.2 | 516.9 |
| 2020 | 491.4 | 503.4 | 415.5 | 275.5 | 389.2 | 541.1 | 613.8 | 593.0 | 558.5 | 509.0 | 466.3 | 443.0 |
| 2021 | 426.6 | 423.2 | 458.7 | 486.6 | 472.2 | 446.1 | 474.6 | 455.3 | 413.7 | 369.5 | 341.5 | 319.3 |
| 2022 | 281.9 | 314.9 | 288.5 | |||||||||
| - = No Data Reported; -- = Not Applicable; NA = Not Available; W = Withheld to avoid disclosure of individual company data. |
| Release Date: 5/19/2022 |
| Next Release Date: TBD |