|
Download Data (XLS File) |
|
||||||||
|
||||||||
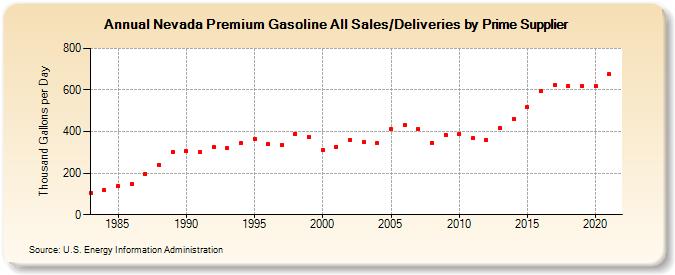
| Nevada Premium Gasoline All Sales/Deliveries by Prime Supplier (Thousand Gallons per Day) | ||||||||
| Decade | Year-0 | Year-1 | Year-2 | Year-3 | Year-4 | Year-5 | Year-6 | Year-7 | Year-8 | Year-9 |
|---|---|---|---|---|---|---|---|---|---|---|
| 1980's | 106.6 | 116.5 | 137.0 | 149.7 | 196.5 | 239.9 | 301.6 | |||
| 1990's | 304.2 | 300.3 | 325.3 | 318.6 | 343.3 | 365.8 | 339.2 | 337.1 | 390.2 | 373.0 |
| 2000's | 309.0 | 327.9 | 361.2 | 348.6 | 342.9 | 411.8 | 430.8 | 411.8 | 347.0 | 384.0 |
| 2010's | 388.5 | 367.6 | 361.5 | 415.3 | 462.0 | 515.7 | 593.5 | 623.9 | 618.7 | 619.6 |
| 2020's | 619.5 |
| - = No Data Reported; -- = Not Applicable; NA = Not Available; W = Withheld to avoid disclosure of individual company data. |
| Release Date: 6/1/2022 |
| Next Release Date: TBD |