|
Download Data (XLS File) |
|
||||||||
|
||||||||
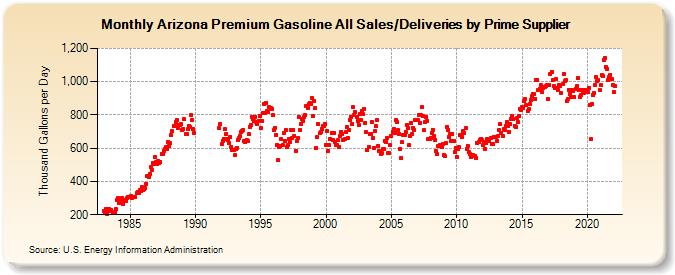
| Arizona Premium Gasoline All Sales/Deliveries by Prime Supplier (Thousand Gallons per Day) | ||||||||
| Year | Jan | Feb | Mar | Apr | May | Jun | Jul | Aug | Sep | Oct | Nov | Dec |
|---|---|---|---|---|---|---|---|---|---|---|---|---|
| 1983 | 220.4 | 218.9 | 236.8 | 206.3 | 219.4 | 235.3 | 223.5 | 226.5 | 215.8 | 214.8 | 216.7 | 235.5 |
| 1984 | 290.3 | 300.3 | 271.5 | 281.8 | 286.5 | 298.3 | 266.9 | 288.9 | 281.1 | 299.6 | 307.6 | 305.4 |
| 1985 | 306.5 | 314.9 | 297.6 | 307.7 | 307.1 | 307.8 | 331.5 | 338.1 | 331.1 | 345.7 | 344.0 | 365.1 |
| 1986 | 346.4 | 351.6 | 361.1 | 386.8 | 433.5 | 426.4 | 446.7 | 485.0 | 470.6 | 510.4 | 505.9 | 549.9 |
| 1987 | 517.1 | 502.6 | 521.5 | 509.8 | 519.0 | 564.6 | 564.5 | 582.7 | 593.1 | 605.5 | 594.6 | 638.4 |
| 1988 | 616.1 | 630.4 | 678.5 | 701.1 | 731.2 | 733.6 | 758.7 | 771.0 | 723.5 | 739.2 | 736.9 | 743.3 |
| 1989 | 711.6 | 717.6 | 773.8 | 686.5 | 684.4 | 713.6 | 734.4 | 729.6 | 799.3 | 770.0 | 715.7 | 693.2 |
| 1990 | W | W | W | W | W | W | W | W | W | W | W | W |
| 1991 | W | W | W | W | W | W | W | W | W | W | 718.7 | 743.3 |
| 1992 | 625.1 | 645.8 | 657.0 | 712.7 | 684.4 | 653.0 | 647.7 | 629.7 | 668.7 | 608.9 | 591.7 | 590.8 |
| 1993 | 557.2 | 593.2 | 602.5 | 647.8 | 659.2 | 671.0 | 699.7 | 705.1 | 710.8 | 645.3 | 634.6 | 650.4 |
| 1994 | 645.1 | 682.8 | 728.9 | 741.7 | 786.9 | 774.0 | 762.8 | 789.7 | 755.6 | 742.8 | 764.1 | 791.7 |
| 1995 | 718.8 | 765.1 | 809.7 | 864.4 | 812.9 | 874.0 | 821.6 | 819.7 | 845.2 | 840.0 | 837.1 | 797.7 |
| 1996 | 707.4 | 724.3 | 681.5 | 620.5 | 528.2 | 604.9 | 610.3 | 653.2 | 619.0 | 689.8 | 646.0 | 708.8 |
| 1997 | 604.4 | 619.8 | 655.7 | 640.1 | 708.3 | 662.9 | 708.8 | 674.6 | 584.6 | 645.6 | 660.6 | 787.8 |
| 1998 | 706.4 | 744.9 | 773.6 | 765.2 | 786.7 | 798.8 | 854.4 | 843.1 | 865.2 | 873.8 | 868.3 | 903.8 |
| 1999 | 792.0 | 886.5 | 843.3 | 604.1 | 664.6 | 743.5 | 690.2 | 696.0 | 716.0 | 730.4 | 733.3 | 746.9 |
| 2000 | 620.5 | 705.9 | 585.2 | 620.2 | 657.3 | 691.1 | 649.7 | 693.8 | 637.7 | 618.5 | 620.0 | 650.0 |
| 2001 | 609.5 | 676.0 | 697.5 | 684.6 | 651.6 | 654.9 | 695.0 | 726.7 | 660.8 | 711.0 | 768.1 | 787.6 |
| 2002 | 746.8 | 844.9 | 801.0 | 816.2 | 786.0 | 763.9 | 742.2 | 808.4 | 771.3 | 821.8 | 802.9 | 838.1 |
| 2003 | 753.0 | 695.0 | 587.8 | 609.8 | 683.3 | 687.9 | 757.8 | 659.1 | 602.8 | 702.6 | 731.6 | 769.4 |
| 2004 | 614.4 | 584.7 | 566.5 | 568.8 | 592.6 | 592.2 | 646.2 | 639.5 | 660.0 | 571.6 | 570.7 | 616.8 |
| 2005 | 673.1 | 699.6 | 714.0 | 689.8 | 769.2 | 754.6 | 707.2 | 687.3 | 597.1 | 541.2 | 634.9 | 679.2 |
| 2006 | 681.1 | 700.3 | 738.7 | 722.7 | 618.5 | 670.3 | 754.4 | 684.6 | 721.6 | 709.4 | 767.6 | 769.3 |
| 2007 | 769.8 | 798.3 | 750.4 | 798.1 | 846.2 | 794.2 | 707.6 | 757.2 | 786.5 | 766.0 | 654.3 | 654.5 |
| 2008 | 663.6 | 693.4 | 711.2 | 674.6 | 651.8 | 582.2 | 562.7 | 614.1 | 611.5 | 620.9 | 605.6 | 622.2 |
| 2009 | 556.1 | 551.0 | 628.6 | 730.2 | 709.3 | 667.6 | 682.5 | 644.0 | 683.9 | 646.1 | 574.2 | 601.3 |
| 2010 | 549.0 | 597.8 | 605.6 | 681.6 | 679.0 | 669.1 | 703.2 | 694.2 | 719.1 | 596.4 | 613.0 | 579.8 |
| 2011 | 564.4 | 548.2 | 553.3 | 557.8 | 550.3 | 551.5 | 541.6 | 633.6 | 635.9 | 648.2 | 658.1 | 651.6 |
| 2012 | 621.8 | 639.2 | 597.9 | 629.6 | 654.7 | 640.8 | 643.2 | 661.8 | 622.8 | 626.9 | 668.3 | 665.0 |
| 2013 | 667.5 | 644.4 | 672.1 | 710.6 | 745.3 | 691.9 | 676.2 | 717.1 | 708.1 | 731.8 | 755.3 | 730.5 |
| 2014 | 699.8 | 743.7 | 778.0 | 790.8 | 774.6 | 735.7 | 726.7 | 779.7 | 758.2 | 795.0 | 835.2 | 830.8 |
| 2015 | 847.1 | 844.3 | 881.5 | 897.2 | 858.3 | 825.5 | 832.9 | 864.6 | 887.7 | 915.3 | 926.4 | 926.2 |
| 2016 | 898.1 | 1,007.1 | 1,011.0 | 950.7 | 956.9 | 977.6 | 936.1 | 962.2 | 968.5 | 967.1 | 972.0 | 978.7 |
| 2017 | 897.8 | 977.9 | 1,048.8 | 1,059.6 | 1,009.4 | 973.7 | 960.2 | 1,015.6 | 960.2 | 951.1 | 980.7 | 974.0 |
| 2018 | 931.1 | 984.6 | 1,046.3 | 1,004.9 | 1,008.2 | 886.6 | 895.5 | 951.7 | 926.6 | 905.7 | 950.2 | 943.0 |
| 2019 | 906.5 | 957.6 | 972.0 | 1,023.1 | 947.1 | 907.8 | 919.5 | 950.6 | 945.7 | 932.9 | 950.8 | 946.6 |
| 2020 | 938.5 | 963.1 | 862.6 | 653.1 | 863.2 | 920.0 | 932.7 | 980.6 | 1,027.2 | 1,005.5 | 1,009.8 | 950.4 |
| 2021 | 977.4 | 1,039.9 | 1,036.1 | 1,131.2 | 1,141.8 | 1,090.2 | 1,075.9 | 1,011.0 | 1,029.7 | 1,042.2 | 1,014.1 | 980.1 |
| 2022 | 935.9 | 973.1 | W | |||||||||
| - = No Data Reported; -- = Not Applicable; NA = Not Available; W = Withheld to avoid disclosure of individual company data. |
| Release Date: 5/19/2022 |
| Next Release Date: TBD |