|
Download Data (XLS File) |
|
||||||||
|
||||||||
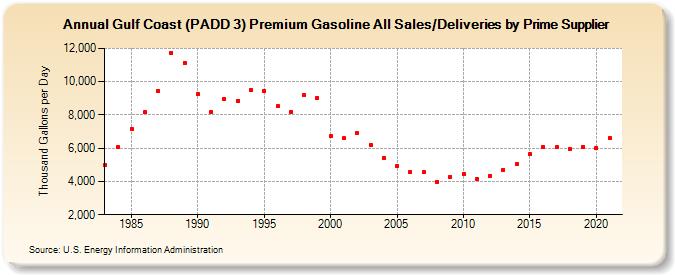
| Gulf Coast (PADD 3) Premium Gasoline All Sales/Deliveries by Prime Supplier (Thousand Gallons per Day) | ||||||||
| Decade | Year-0 | Year-1 | Year-2 | Year-3 | Year-4 | Year-5 | Year-6 | Year-7 | Year-8 | Year-9 |
|---|---|---|---|---|---|---|---|---|---|---|
| 1980's | 4,988.5 | 6,068.7 | 7,177.8 | 8,147.7 | 9,459.6 | 11,749.7 | 11,138.4 | |||
| 1990's | 9,243.8 | 8,189.1 | 8,942.1 | 8,857.5 | 9,492.1 | 9,446.7 | 8,519.6 | 8,193.0 | 9,184.8 | 9,018.3 |
| 2000's | 6,721.5 | 6,585.6 | 6,886.0 | 6,194.1 | 5,435.7 | 4,931.3 | 4,542.2 | 4,555.2 | 3,971.1 | 4,288.4 |
| 2010's | 4,467.8 | 4,156.6 | 4,355.6 | 4,713.5 | 5,022.9 | 5,646.3 | 6,069.3 | 6,044.2 | 5,951.8 | 6,097.4 |
| 2020's | 6,034.6 |
| - = No Data Reported; -- = Not Applicable; NA = Not Available; W = Withheld to avoid disclosure of individual company data. |
| Release Date: 6/1/2022 |
| Next Release Date: TBD |