|
Download Data (XLS File) |
|
||||||||
|
||||||||
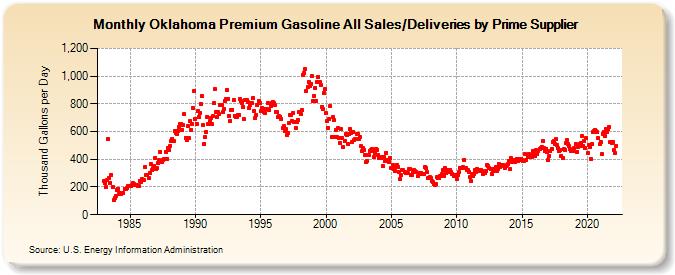
| Oklahoma Premium Gasoline All Sales/Deliveries by Prime Supplier (Thousand Gallons per Day) | ||||||||
| Year | Jan | Feb | Mar | Apr | May | Jun | Jul | Aug | Sep | Oct | Nov | Dec |
|---|---|---|---|---|---|---|---|---|---|---|---|---|
| 1983 | 241.5 | 229.9 | 196.4 | 248.6 | 547.9 | 265.2 | 230.7 | 288.1 | 200.3 | 106.3 | 120.5 | 137.2 |
| 1984 | 181.8 | 188.9 | 151.5 | 153.6 | 151.3 | 154.6 | 157.0 | 188.8 | 182.0 | 189.2 | 203.6 | 206.8 |
| 1985 | 207.5 | 209.3 | 216.6 | 225.7 | 221.5 | 214.5 | 212.9 | 209.1 | 209.5 | 246.5 | 239.0 | 256.0 |
| 1986 | 253.8 | 251.9 | 346.6 | 283.7 | 289.3 | 261.8 | 299.5 | 364.1 | 319.8 | 336.5 | 353.6 | 411.6 |
| 1987 | 329.2 | 334.1 | 371.5 | 391.3 | 455.5 | 383.3 | 394.4 | 400.0 | 399.1 | 454.8 | 404.7 | 477.9 |
| 1988 | 469.0 | 499.2 | 534.0 | 547.2 | 530.4 | 603.6 | 590.4 | 580.0 | 605.4 | 631.0 | 656.8 | 654.8 |
| 1989 | 611.8 | 644.6 | 726.5 | 555.9 | 535.7 | 639.1 | 551.4 | 676.1 | 614.8 | 657.0 | 772.1 | 895.7 |
| 1990 | 692.9 | 657.6 | 745.7 | 706.3 | 732.9 | 799.4 | 859.5 | 649.5 | 511.9 | 559.5 | 599.4 | 707.0 |
| 1991 | 656.8 | 674.3 | 700.2 | 651.7 | 710.2 | 803.4 | 905.9 | 742.8 | 707.0 | 737.7 | 724.2 | 790.7 |
| 1992 | 792.0 | 742.1 | 760.7 | 823.6 | 832.9 | 903.1 | 836.1 | 714.7 | 676.2 | 755.1 | 758.7 | 828.7 |
| 1993 | 712.4 | 703.5 | 701.5 | 722.4 | 720.7 | 838.0 | 821.3 | 804.4 | 779.3 | 687.4 | 827.4 | 826.6 |
| 1994 | 813.2 | 770.3 | 792.3 | 808.5 | 808.8 | 841.3 | 751.2 | 699.3 | 718.8 | 789.7 | 817.1 | 804.6 |
| 1995 | 744.9 | 772.9 | 759.4 | 743.6 | 733.4 | 765.1 | 763.6 | 802.6 | 758.2 | 786.2 | 809.5 | 816.4 |
| 1996 | 802.5 | 791.7 | 741.7 | 740.3 | 702.0 | 710.4 | 707.3 | 690.5 | 624.4 | 636.8 | 606.8 | 616.1 |
| 1997 | 573.3 | 591.2 | 663.4 | 723.0 | 721.7 | 676.0 | 734.1 | 670.3 | 624.1 | 670.6 | 683.1 | 737.7 |
| 1998 | 741.9 | 726.6 | 751.9 | 1,010.2 | 1,023.7 | 1,049.3 | 893.6 | 919.3 | 957.0 | 925.5 | 944.7 | 997.2 |
| 1999 | 823.9 | 858.4 | 916.4 | 820.5 | 958.7 | 994.7 | 954.1 | 932.9 | 780.1 | 762.3 | 877.3 | 904.6 |
| 2000 | 731.3 | 674.7 | 628.9 | 688.4 | 781.3 | 559.0 | 702.3 | 682.5 | 559.0 | 610.4 | 558.9 | 623.9 |
| 2001 | 555.3 | 516.6 | 616.5 | 552.0 | 486.6 | 528.9 | 583.3 | 576.6 | 510.1 | 580.2 | 614.9 | 591.8 |
| 2002 | 525.2 | 598.3 | 536.8 | 546.6 | 583.6 | 584.1 | 549.8 | 563.7 | 492.3 | 460.0 | 478.2 | 469.3 |
| 2003 | 433.1 | 377.0 | 389.6 | 432.8 | 458.6 | 465.2 | 477.2 | 461.7 | 416.4 | 444.5 | 476.1 | 469.8 |
| 2004 | 430.3 | 411.6 | 411.7 | 419.3 | 349.7 | 414.8 | 384.2 | 447.9 | 391.8 | 386.5 | 381.3 | 410.9 |
| 2005 | 336.5 | 358.3 | 327.7 | 318.2 | 350.4 | 361.9 | 344.4 | 310.7 | 260.6 | 283.4 | 321.2 | 319.8 |
| 2006 | 305.3 | 299.6 | 299.5 | 298.2 | 328.5 | 328.4 | 286.2 | 284.5 | 305.3 | 321.6 | 313.2 | 310.5 |
| 2007 | 277.3 | 300.8 | 304.5 | 303.9 | 291.6 | 297.1 | 291.7 | 346.7 | 334.4 | 305.9 | 264.3 | 272.9 |
| 2008 | 262.5 | 246.3 | 237.5 | 221.0 | 213.1 | 218.1 | 270.7 | 261.7 | 267.2 | 280.5 | 291.5 | 323.5 |
| 2009 | 282.5 | 337.9 | 301.4 | 323.3 | 308.2 | 307.1 | 320.0 | 308.3 | 295.2 | 280.7 | 283.8 | 285.5 |
| 2010 | 257.5 | 286.4 | 307.9 | 339.4 | 334.4 | 340.2 | 342.2 | 396.8 | 339.8 | 325.1 | 324.7 | 310.7 |
| 2011 | 270.9 | 245.9 | 296.0 | 280.3 | 293.3 | 322.1 | 308.6 | 328.5 | 316.4 | 321.7 | 324.4 | 313.5 |
| 2012 | 296.3 | 303.7 | 301.2 | 318.7 | 360.2 | 350.7 | 338.1 | 331.4 | 294.0 | 314.4 | 326.7 | 324.3 |
| 2013 | 341.2 | 316.4 | 331.9 | 365.4 | 345.1 | 357.0 | 358.5 | 353.5 | 337.4 | 354.5 | 359.9 | 366.8 |
| 2014 | 389.4 | 328.3 | 406.5 | 382.7 | 392.0 | 376.9 | 394.3 | 402.2 | 388.3 | 400.5 | 391.3 | 404.7 |
| 2015 | 395.1 | 390.0 | 390.5 | 435.3 | 397.5 | 420.0 | 439.3 | 412.9 | 432.7 | 413.2 | 460.6 | 435.3 |
| 2016 | 421.6 | 465.9 | 441.3 | 461.0 | 475.0 | 482.6 | 486.3 | 530.3 | 483.5 | 460.8 | 476.3 | 452.1 |
| 2017 | 394.7 | 422.6 | 460.7 | 477.4 | 526.4 | 529.9 | 513.0 | 544.2 | 502.7 | 479.4 | 457.3 | 467.1 |
| 2018 | 426.4 | 411.3 | 471.8 | 467.2 | 517.7 | 537.8 | 510.0 | 495.6 | 470.7 | 456.2 | 465.7 | 458.3 |
| 2019 | 477.8 | 511.9 | 451.6 | 488.9 | 493.9 | 510.6 | 517.6 | 567.2 | 499.1 | 532.8 | 480.3 | 550.9 |
| 2020 | 446.2 | 503.9 | 490.6 | 401.5 | 507.2 | 599.3 | 602.0 | 610.0 | 601.0 | 594.6 | 550.9 | 507.5 |
| 2021 | 524.7 | 438.0 | 583.6 | 597.8 | 567.0 | 618.8 | 596.9 | 617.5 | 633.2 | 523.4 | 520.8 | 526.1 |
| 2022 | 465.4 | 442.5 | 498.9 | |||||||||
| - = No Data Reported; -- = Not Applicable; NA = Not Available; W = Withheld to avoid disclosure of individual company data. |
| Release Date: 5/19/2022 |
| Next Release Date: TBD |