|
Download Data (XLS File) |
|
||||||||
|
||||||||
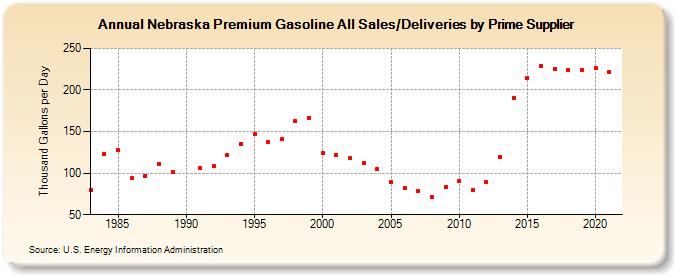
| Nebraska Premium Gasoline All Sales/Deliveries by Prime Supplier (Thousand Gallons per Day) | ||||||||
| Decade | Year-0 | Year-1 | Year-2 | Year-3 | Year-4 | Year-5 | Year-6 | Year-7 | Year-8 | Year-9 |
|---|---|---|---|---|---|---|---|---|---|---|
| 1980's | 79.2 | 123.4 | 127.4 | 93.7 | 96.9 | 110.9 | 101.5 | |||
| 1990's | W | 106.4 | 108.4 | 122.1 | 135.4 | 147.0 | 136.9 | 140.6 | 162.5 | 166.6 |
| 2000's | 123.9 | 121.4 | 117.8 | 112.6 | 105.1 | 89.2 | 82.4 | 78.8 | 71.8 | 83.8 |
| 2010's | 90.7 | 80.0 | 89.5 | 119.1 | 190.4 | 214.1 | 229.2 | 225.1 | 224.3 | 224.3 |
| 2020's | 226.1 |
| - = No Data Reported; -- = Not Applicable; NA = Not Available; W = Withheld to avoid disclosure of individual company data. |
| Release Date: 6/1/2022 |
| Next Release Date: TBD |