|
Download Data (XLS File) |
|
||||||||
|
||||||||
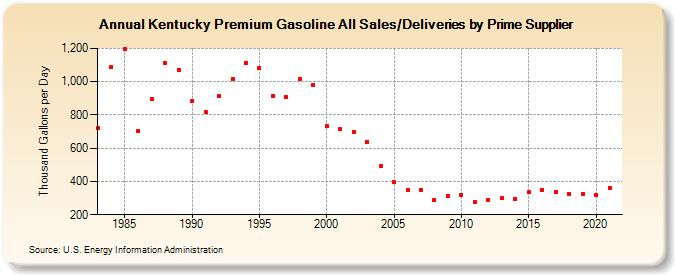
| Kentucky Premium Gasoline All Sales/Deliveries by Prime Supplier (Thousand Gallons per Day) | ||||||||
| Decade | Year-0 | Year-1 | Year-2 | Year-3 | Year-4 | Year-5 | Year-6 | Year-7 | Year-8 | Year-9 |
|---|---|---|---|---|---|---|---|---|---|---|
| 1980's | 720.2 | 1,089.3 | 1,194.6 | 704.0 | 893.4 | 1,109.2 | 1,070.2 | |||
| 1990's | 885.9 | 818.7 | 912.8 | 1,016.8 | 1,112.5 | 1,081.1 | 915.3 | 907.3 | 1,016.1 | 979.8 |
| 2000's | 736.0 | 713.9 | 698.1 | 638.3 | 491.0 | 393.8 | 350.6 | 348.7 | 287.2 | 314.5 |
| 2010's | 317.5 | 278.4 | 290.2 | 299.6 | 296.3 | 337.9 | 351.0 | 338.3 | 322.0 | 323.3 |
| 2020's | 319.2 |
| - = No Data Reported; -- = Not Applicable; NA = Not Available; W = Withheld to avoid disclosure of individual company data. |
| Release Date: 6/1/2022 |
| Next Release Date: TBD |