|
Download Data (XLS File) |
|
||||||||
|
||||||||
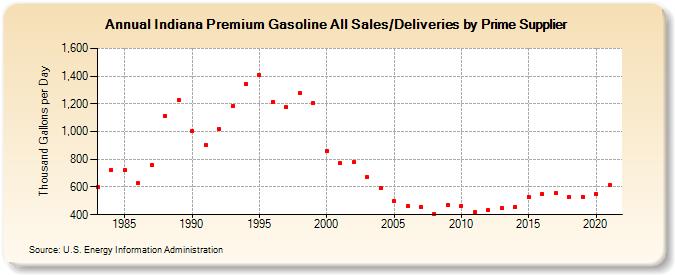
| Indiana Premium Gasoline All Sales/Deliveries by Prime Supplier (Thousand Gallons per Day) | ||||||||
| Decade | Year-0 | Year-1 | Year-2 | Year-3 | Year-4 | Year-5 | Year-6 | Year-7 | Year-8 | Year-9 |
|---|---|---|---|---|---|---|---|---|---|---|
| 1980's | 598.6 | 723.5 | 723.7 | 626.4 | 757.4 | 1,112.5 | 1,226.0 | |||
| 1990's | 1,004.4 | 903.6 | 1,019.0 | 1,182.9 | 1,344.8 | 1,405.2 | 1,215.6 | 1,176.0 | 1,276.3 | 1,205.2 |
| 2000's | 860.4 | 772.6 | 777.6 | 671.6 | 590.2 | 498.8 | 460.4 | 458.8 | 406.8 | 466.7 |
| 2010's | 464.8 | 416.8 | 431.2 | 451.9 | 457.6 | 531.1 | 551.9 | 556.1 | 526.6 | 530.7 |
| 2020's | 550.7 |
| - = No Data Reported; -- = Not Applicable; NA = Not Available; W = Withheld to avoid disclosure of individual company data. |
| Release Date: 6/1/2022 |
| Next Release Date: TBD |