|
Download Data (XLS File) |
|
||||||||
|
||||||||
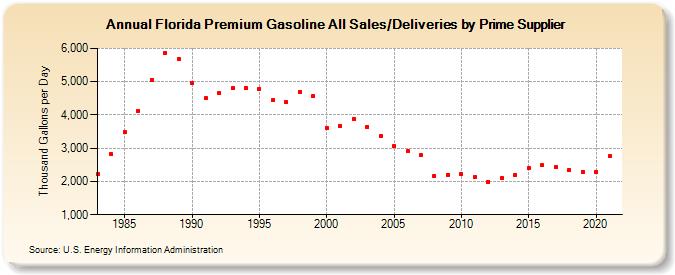
| Florida Premium Gasoline All Sales/Deliveries by Prime Supplier (Thousand Gallons per Day) | ||||||||
| Decade | Year-0 | Year-1 | Year-2 | Year-3 | Year-4 | Year-5 | Year-6 | Year-7 | Year-8 | Year-9 |
|---|---|---|---|---|---|---|---|---|---|---|
| 1980's | 2,210.9 | 2,817.7 | 3,481.4 | 4,131.2 | 5,061.2 | 5,857.9 | 5,689.1 | |||
| 1990's | 4,956.6 | 4,498.1 | 4,644.6 | 4,799.9 | 4,817.8 | 4,788.2 | 4,434.7 | 4,387.9 | 4,703.9 | 4,561.9 |
| 2000's | 3,620.2 | 3,675.5 | 3,883.1 | 3,644.8 | 3,357.9 | 3,065.3 | 2,906.0 | 2,792.0 | 2,170.4 | 2,206.3 |
| 2010's | 2,218.4 | 2,130.2 | 1,993.9 | 2,106.4 | 2,204.1 | 2,406.6 | 2,480.0 | 2,421.8 | 2,343.9 | 2,298.0 |
| 2020's | 2,292.4 |
| - = No Data Reported; -- = Not Applicable; NA = Not Available; W = Withheld to avoid disclosure of individual company data. |
| Release Date: 6/1/2022 |
| Next Release Date: TBD |