|
Download Data (XLS File) |
|
||||||||
|
||||||||
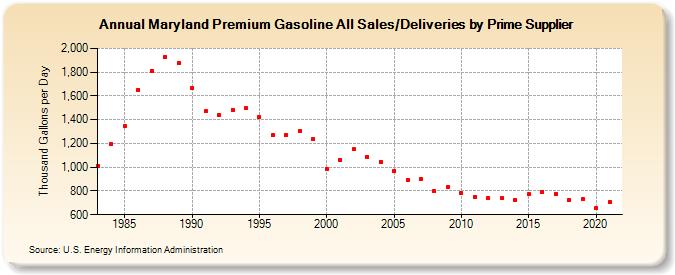
| Maryland Premium Gasoline All Sales/Deliveries by Prime Supplier (Thousand Gallons per Day) | ||||||||
| Decade | Year-0 | Year-1 | Year-2 | Year-3 | Year-4 | Year-5 | Year-6 | Year-7 | Year-8 | Year-9 |
|---|---|---|---|---|---|---|---|---|---|---|
| 1980's | 1,013.1 | 1,193.9 | 1,342.7 | 1,652.2 | 1,811.7 | 1,927.4 | 1,877.1 | |||
| 1990's | 1,663.5 | 1,470.7 | 1,439.4 | 1,482.5 | 1,496.1 | 1,421.2 | 1,270.3 | 1,269.8 | 1,307.1 | 1,238.9 |
| 2000's | 987.1 | 1,062.9 | 1,150.2 | 1,088.3 | 1,047.2 | 969.4 | 891.7 | 902.0 | 795.5 | 831.8 |
| 2010's | 779.5 | 752.3 | 738.5 | 743.7 | 724.3 | 772.0 | 793.5 | 775.1 | 724.4 | 729.9 |
| 2020's | 652.6 |
| - = No Data Reported; -- = Not Applicable; NA = Not Available; W = Withheld to avoid disclosure of individual company data. |
| Release Date: 6/1/2022 |
| Next Release Date: TBD |