|
Download Data (XLS File) |
|
||||||||
|
||||||||
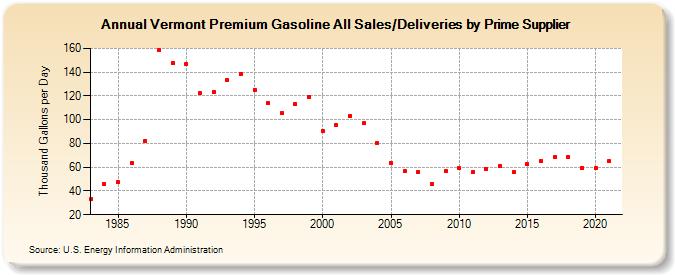
| Vermont Premium Gasoline All Sales/Deliveries by Prime Supplier (Thousand Gallons per Day) | ||||||||
| Decade | Year-0 | Year-1 | Year-2 | Year-3 | Year-4 | Year-5 | Year-6 | Year-7 | Year-8 | Year-9 |
|---|---|---|---|---|---|---|---|---|---|---|
| 1980's | 32.9 | 45.6 | 47.3 | 63.7 | 82.2 | 158.7 | 147.7 | |||
| 1990's | 146.9 | 122.1 | 123.7 | 133.0 | 138.1 | 125.2 | 113.8 | 105.6 | 113.0 | 119.4 |
| 2000's | 90.4 | 95.1 | 103.5 | 96.8 | 80.2 | 63.9 | 56.7 | 56.2 | 45.8 | 56.5 |
| 2010's | 59.4 | 55.7 | 58.3 | 60.8 | 55.6 | 62.4 | 65.4 | 68.2 | 68.6 | 59.7 |
| 2020's | 59.5 |
| - = No Data Reported; -- = Not Applicable; NA = Not Available; W = Withheld to avoid disclosure of individual company data. |
| Release Date: 6/1/2022 |
| Next Release Date: TBD |