|
Download Data (XLS File) |
|
||||||||
|
||||||||
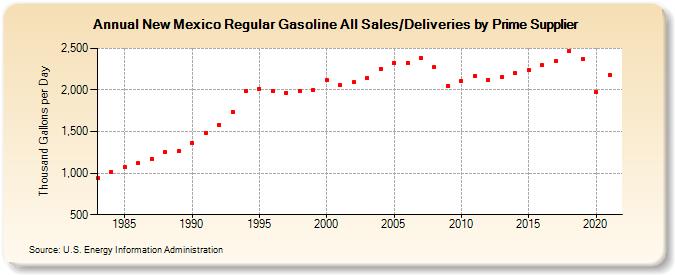
| New Mexico Regular Gasoline All Sales/Deliveries by Prime Supplier (Thousand Gallons per Day) | ||||||||
| Decade | Year-0 | Year-1 | Year-2 | Year-3 | Year-4 | Year-5 | Year-6 | Year-7 | Year-8 | Year-9 |
|---|---|---|---|---|---|---|---|---|---|---|
| 1980's | 940.2 | 1,014.6 | 1,068.4 | 1,117.8 | 1,171.5 | 1,249.1 | 1,260.6 | |||
| 1990's | 1,363.4 | 1,482.6 | 1,584.7 | 1,739.6 | 1,990.5 | 2,015.5 | 1,993.2 | 1,967.9 | 1,986.5 | 1,996.7 |
| 2000's | 2,116.3 | 2,055.5 | 2,090.5 | 2,147.5 | 2,257.0 | 2,328.0 | 2,325.9 | 2,385.3 | 2,272.6 | 2,051.0 |
| 2010's | 2,105.6 | 2,169.9 | 2,121.6 | 2,155.4 | 2,199.7 | 2,237.8 | 2,295.7 | 2,345.0 | 2,468.4 | 2,377.5 |
| 2020's | 1,975.0 |
| - = No Data Reported; -- = Not Applicable; NA = Not Available; W = Withheld to avoid disclosure of individual company data. |
| Release Date: 6/1/2022 |
| Next Release Date: TBD |