|
Download Data (XLS File) |
|
||||||||
|
||||||||
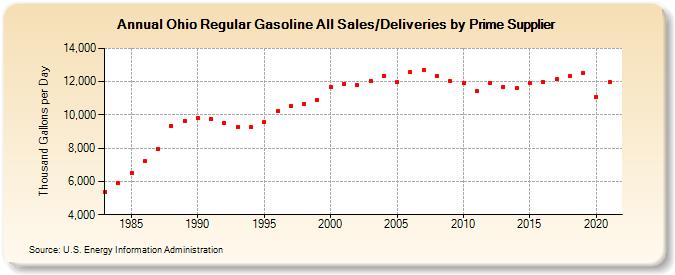
| Ohio Regular Gasoline All Sales/Deliveries by Prime Supplier (Thousand Gallons per Day) | ||||||||
| Decade | Year-0 | Year-1 | Year-2 | Year-3 | Year-4 | Year-5 | Year-6 | Year-7 | Year-8 | Year-9 |
|---|---|---|---|---|---|---|---|---|---|---|
| 1980's | 5,375.4 | 5,885.8 | 6,503.9 | 7,212.2 | 7,948.1 | 9,322.8 | 9,628.3 | |||
| 1990's | 9,793.8 | 9,779.1 | 9,506.6 | 9,289.0 | 9,248.7 | 9,588.7 | 10,205.9 | 10,561.2 | 10,658.0 | 10,898.8 |
| 2000's | 11,698.0 | 11,846.9 | 11,796.7 | 12,033.9 | 12,331.4 | 11,956.2 | 12,575.9 | 12,719.8 | 12,352.7 | 12,016.3 |
| 2010's | 11,917.9 | 11,415.3 | 11,922.8 | 11,696.8 | 11,612.7 | 11,902.9 | 11,975.9 | 12,131.2 | 12,317.7 | 12,544.5 |
| 2020's | 11,091.8 |
| - = No Data Reported; -- = Not Applicable; NA = Not Available; W = Withheld to avoid disclosure of individual company data. |
| Release Date: 6/1/2022 |
| Next Release Date: TBD |