|
Download Data (XLS File) |
|
||||||||
|
||||||||
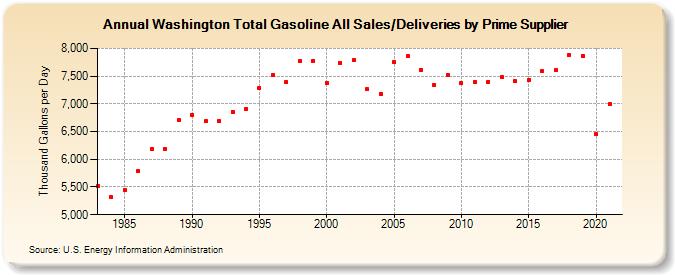
| Washington Total Gasoline All Sales/Deliveries by Prime Supplier (Thousand Gallons per Day) | ||||||||
| Decade | Year-0 | Year-1 | Year-2 | Year-3 | Year-4 | Year-5 | Year-6 | Year-7 | Year-8 | Year-9 |
|---|---|---|---|---|---|---|---|---|---|---|
| 1980's | 5,511.1 | 5,313.7 | 5,446.1 | 5,786.1 | 6,189.2 | 6,186.3 | 6,706.1 | |||
| 1990's | 6,803.1 | 6,683.6 | 6,682.6 | 6,858.1 | 6,911.0 | 7,288.4 | 7,520.2 | 7,394.1 | 7,763.9 | 7,772.8 |
| 2000's | 7,377.0 | 7,742.3 | 7,786.4 | 7,259.6 | 7,180.5 | 7,752.7 | 7,860.1 | 7,617.5 | 7,341.5 | 7,515.8 |
| 2010's | 7,367.4 | 7,396.4 | 7,399.2 | 7,485.7 | 7,408.3 | 7,427.7 | 7,584.8 | 7,603.4 | 7,878.0 | 7,867.4 |
| 2020's | 6,449.9 |
| - = No Data Reported; -- = Not Applicable; NA = Not Available; W = Withheld to avoid disclosure of individual company data. |
| Release Date: 6/1/2022 |
| Next Release Date: TBD |