|
Download Data (XLS File) |
|
||||||||
|
||||||||
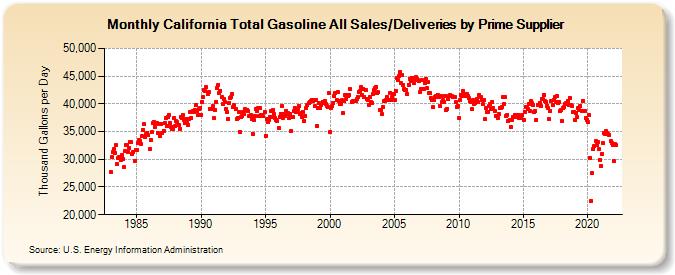
| California Total Gasoline All Sales/Deliveries by Prime Supplier (Thousand Gallons per Day) | ||||||||
| Year | Jan | Feb | Mar | Apr | May | Jun | Jul | Aug | Sep | Oct | Nov | Dec |
|---|---|---|---|---|---|---|---|---|---|---|---|---|
| 1983 | 27,624.9 | 30,346.9 | 31,367.0 | 31,891.6 | 31,149.4 | 32,530.9 | 29,107.7 | 30,168.7 | 30,326.4 | 29,903.4 | 30,741.2 | 30,138.7 |
| 1984 | 28,553.1 | 31,472.9 | 32,546.3 | 32,550.1 | 31,374.7 | 31,996.0 | 33,150.1 | 33,094.8 | 30,997.6 | 31,396.0 | 29,684.7 | 31,666.3 |
| 1985 | 31,726.5 | 32,864.1 | 33,435.6 | 33,367.6 | 32,668.4 | 34,151.8 | 35,360.9 | 36,291.2 | 34,083.7 | 34,604.2 | 34,817.1 | 34,307.9 |
| 1986 | 31,834.9 | 33,538.8 | 34,834.0 | 36,487.0 | 36,774.0 | 35,909.7 | 36,516.6 | 36,497.7 | 34,671.4 | 36,382.3 | 34,133.6 | 36,422.4 |
| 1987 | 34,789.3 | 35,175.5 | 36,544.4 | 37,374.9 | 36,000.1 | 37,647.9 | 37,954.0 | 36,511.8 | 35,906.1 | 35,523.4 | 35,466.2 | 37,403.0 |
| 1988 | 36,008.4 | 36,898.7 | 36,711.6 | 36,189.9 | 35,422.6 | 37,714.8 | 37,399.8 | 38,030.7 | 37,142.3 | 36,516.5 | 37,329.0 | 36,596.1 |
| 1989 | 36,238.4 | 37,183.8 | 38,476.7 | 37,480.6 | 38,708.7 | 38,576.6 | 38,899.0 | 39,719.8 | 38,633.5 | 37,969.4 | 39,005.7 | 39,256.3 |
| 1990 | 38,058.3 | 40,399.2 | 41,222.1 | 42,552.5 | 42,340.6 | 42,983.1 | 41,692.9 | 42,113.0 | 39,125.4 | 38,996.7 | 39,078.1 | 39,550.5 |
| 1991 | 37,397.1 | 38,896.5 | 40,288.6 | 42,915.4 | 43,448.7 | 41,887.1 | 42,342.1 | 41,194.2 | 39,953.1 | 40,913.0 | 40,258.3 | 39,135.6 |
| 1992 | 38,503.3 | 37,249.7 | 40,213.5 | 41,105.6 | 41,194.2 | 41,797.2 | 39,442.0 | 39,738.7 | 38,995.3 | 37,233.7 | 37,406.0 | 38,584.9 |
| 1993 | 34,974.0 | 37,553.5 | 37,805.0 | 38,441.8 | 38,122.4 | 38,984.5 | 38,883.0 | 38,972.2 | 38,646.2 | 37,804.4 | 37,948.3 | 37,203.5 |
| 1994 | 34,592.0 | 37,076.0 | 37,876.3 | 39,039.5 | 38,710.3 | 39,180.6 | 37,823.8 | 39,248.0 | 38,068.4 | 38,001.5 | 37,726.8 | 38,538.0 |
| 1995 | 34,287.3 | 37,227.4 | 36,812.2 | 37,114.6 | 37,644.5 | 38,668.3 | 37,545.7 | 38,895.5 | 38,159.2 | 37,512.4 | 37,135.1 | 36,879.5 |
| 1996 | 35,704.6 | 37,687.0 | 38,232.7 | 39,633.6 | 37,377.6 | 38,191.0 | 37,788.9 | 38,766.0 | 38,174.4 | 38,295.0 | 37,519.5 | 38,207.1 |
| 1997 | 35,188.5 | 37,628.5 | 38,622.4 | 39,253.3 | 38,543.4 | 38,539.5 | 38,979.4 | 39,560.5 | 38,134.3 | 38,315.5 | 37,630.6 | 38,572.3 |
| 1998 | 36,837.3 | 37,857.8 | 39,261.7 | 39,789.5 | 40,099.1 | 40,365.5 | 40,515.6 | 40,776.1 | 40,435.1 | 40,752.9 | 39,555.9 | 40,666.7 |
| 1999 | 36,009.2 | 39,282.4 | 40,131.6 | 39,206.7 | 39,764.7 | 40,412.4 | 40,174.5 | 40,458.9 | 39,991.6 | 39,566.4 | 39,357.6 | 41,996.3 |
| 2000 | 34,902.3 | 39,245.5 | 39,631.4 | 40,234.3 | 41,360.0 | 42,021.7 | 40,608.1 | 42,149.1 | 40,469.2 | 39,983.8 | 40,003.8 | 40,640.5 |
| 2001 | 38,335.3 | 40,566.6 | 41,540.4 | 40,956.6 | 41,548.3 | 41,401.3 | 41,627.5 | 42,633.6 | 40,376.8 | 40,490.4 | 40,455.3 | 40,484.0 |
| 2002 | 40,442.2 | 40,957.0 | 41,261.2 | 42,195.5 | 42,224.4 | 43,024.1 | 41,543.6 | 42,643.9 | 41,264.2 | 42,507.7 | 40,952.1 | 40,722.4 |
| 2003 | 39,836.2 | 41,244.5 | 40,419.5 | 40,199.3 | 41,777.4 | 42,419.5 | 42,776.3 | 43,112.7 | 41,967.7 | 42,065.0 | 38,911.9 | 38,819.0 |
| 2004 | 38,208.6 | 39,415.7 | 40,476.0 | 40,481.0 | 40,746.6 | 41,184.3 | 40,665.1 | 40,778.0 | 42,026.0 | 40,758.0 | 41,173.5 | 41,825.1 |
| 2005 | 40,756.3 | 42,366.8 | 44,581.6 | 44,283.0 | 44,960.5 | 45,697.4 | 43,686.2 | 45,126.6 | 43,419.1 | 42,720.3 | 42,504.5 | 42,559.8 |
| 2006 | 41,733.7 | 43,449.6 | 44,536.6 | 44,062.3 | 44,688.3 | 44,650.4 | 43,806.9 | 44,391.7 | 44,774.2 | 44,553.1 | 44,282.1 | 44,070.2 |
| 2007 | 42,216.1 | 42,758.5 | 44,283.6 | 42,688.1 | 43,765.7 | 44,524.8 | 42,852.0 | 43,874.3 | 41,944.0 | 41,932.4 | 40,973.0 | 40,759.7 |
| 2008 | 39,344.4 | 40,748.0 | 41,157.4 | 41,392.0 | 41,639.7 | 41,215.9 | 39,633.3 | 41,373.8 | 40,313.0 | 40,635.3 | 40,279.6 | 41,477.8 |
| 2009 | 38,815.0 | 39,097.4 | 40,857.5 | 41,492.0 | 41,546.9 | 41,342.8 | 41,189.7 | 41,147.8 | 41,154.0 | 40,370.7 | 39,489.1 | 39,657.0 |
| 2010 | 37,370.1 | 40,729.8 | 41,654.0 | 41,480.1 | 42,272.1 | 41,776.2 | 41,423.5 | 41,736.9 | 41,482.2 | 41,035.6 | 40,431.0 | 40,274.3 |
| 2011 | 39,119.0 | 40,696.2 | 40,023.5 | 40,118.4 | 40,295.6 | 40,943.5 | 40,293.9 | 41,603.5 | 41,298.0 | 40,704.8 | 39,918.4 | 40,728.7 |
| 2012 | 37,200.6 | 39,228.4 | 38,529.0 | 38,614.6 | 39,523.8 | 39,991.0 | 39,004.6 | 40,295.0 | 39,236.0 | 38,636.8 | 37,808.5 | 37,817.4 |
| 2013 | 37,511.4 | 38,141.5 | 39,226.6 | 39,316.8 | 39,465.7 | 41,213.8 | 40,038.5 | 41,223.2 | 37,861.3 | 38,048.3 | 36,954.9 | 37,094.6 |
| 2014 | 35,879.3 | 37,082.1 | 37,620.2 | 37,661.5 | 38,053.9 | 37,590.1 | 37,662.3 | 38,062.2 | 37,528.4 | 37,844.9 | 37,495.5 | 38,066.5 |
| 2015 | 37,031.6 | 38,608.6 | 39,497.0 | 39,349.0 | 39,000.9 | 39,997.0 | 38,757.0 | 40,441.0 | 40,105.6 | 39,754.9 | 38,491.7 | 38,654.7 |
| 2016 | 37,154.1 | 39,840.1 | 39,792.9 | 40,174.9 | 39,602.7 | 40,904.7 | 40,827.3 | 41,659.6 | 40,421.5 | 40,369.6 | 39,668.5 | 39,208.4 |
| 2017 | 37,225.2 | 38,679.6 | 40,572.9 | 39,791.1 | 40,732.6 | 41,230.9 | 40,352.4 | 41,419.8 | 40,212.6 | 40,333.6 | 38,633.1 | 38,968.7 |
| 2018 | 36,873.2 | 39,211.8 | 39,429.8 | 39,905.6 | 40,136.2 | 40,475.2 | 39,835.3 | 41,070.5 | 39,825.4 | 39,537.3 | 38,553.6 | 38,591.6 |
| 2019 | 37,062.5 | 38,322.0 | 37,675.3 | 39,331.5 | 38,889.0 | 39,695.5 | 38,714.9 | 40,538.4 | 38,777.7 | 38,720.5 | 37,525.2 | 37,170.0 |
| 2020 | 36,639.5 | 38,001.6 | 30,314.2 | 22,534.5 | 27,489.3 | 31,800.5 | 32,326.3 | 33,243.4 | 32,601.6 | 33,204.8 | 31,771.7 | 29,958.5 |
| 2021 | 28,750.5 | 31,034.4 | 32,894.9 | 34,768.7 | 34,586.1 | 35,021.2 | 34,811.9 | 34,593.5 | 34,431.9 | 33,266.4 | 32,910.4 | 32,520.6 |
| 2022 | 29,603.6 | 32,841.6 | 32,593.8 | |||||||||
| - = No Data Reported; -- = Not Applicable; NA = Not Available; W = Withheld to avoid disclosure of individual company data. |
| Release Date: 5/19/2022 |
| Next Release Date: TBD |