|
Download Data (XLS File) |
|
||||||||
|
||||||||
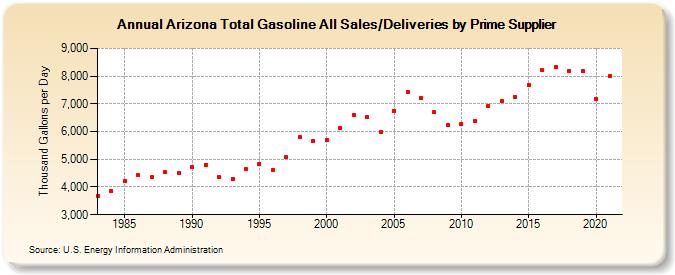
| Arizona Total Gasoline All Sales/Deliveries by Prime Supplier (Thousand Gallons per Day) | ||||||||
| Decade | Year-0 | Year-1 | Year-2 | Year-3 | Year-4 | Year-5 | Year-6 | Year-7 | Year-8 | Year-9 |
|---|---|---|---|---|---|---|---|---|---|---|
| 1980's | 3,685.7 | 3,843.8 | 4,219.3 | 4,422.8 | 4,357.8 | 4,529.5 | 4,487.7 | |||
| 1990's | 4,710.7 | 4,804.0 | 4,366.2 | 4,289.5 | 4,637.6 | 4,839.5 | 4,618.2 | 5,071.5 | 5,797.0 | 5,653.4 |
| 2000's | 5,701.6 | 6,125.7 | 6,604.6 | 6,515.7 | 5,993.0 | 6,755.1 | 7,428.5 | 7,202.6 | 6,692.6 | 6,224.8 |
| 2010's | 6,271.6 | 6,365.0 | 6,937.4 | 7,101.2 | 7,262.4 | 7,692.2 | 8,226.9 | 8,331.3 | 8,201.5 | 8,166.5 |
| 2020's | 7,183.4 |
| - = No Data Reported; -- = Not Applicable; NA = Not Available; W = Withheld to avoid disclosure of individual company data. |
| Release Date: 6/1/2022 |
| Next Release Date: TBD |