|
Download Data (XLS File) |
|
||||||||
|
||||||||
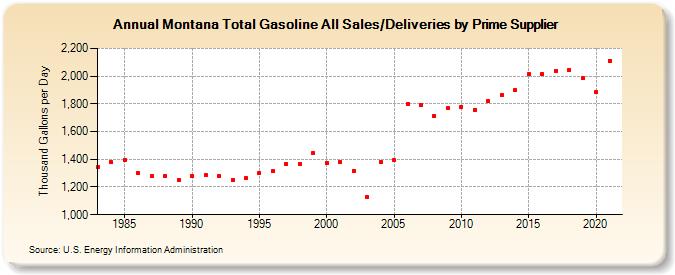
| Montana Total Gasoline All Sales/Deliveries by Prime Supplier (Thousand Gallons per Day) | ||||||||
| Decade | Year-0 | Year-1 | Year-2 | Year-3 | Year-4 | Year-5 | Year-6 | Year-7 | Year-8 | Year-9 |
|---|---|---|---|---|---|---|---|---|---|---|
| 1980's | 1,344.8 | 1,380.2 | 1,393.1 | 1,300.4 | 1,277.4 | 1,280.3 | 1,253.8 | |||
| 1990's | 1,282.7 | 1,284.3 | 1,281.2 | 1,250.3 | 1,264.4 | 1,301.1 | 1,311.8 | 1,367.7 | 1,368.2 | 1,443.6 |
| 2000's | 1,375.4 | 1,380.3 | 1,317.4 | 1,125.8 | 1,378.7 | 1,394.6 | 1,798.4 | 1,789.8 | 1,714.2 | 1,766.9 |
| 2010's | 1,776.2 | 1,759.1 | 1,820.3 | 1,864.4 | 1,896.6 | 2,017.0 | 2,017.5 | 2,038.7 | 2,045.5 | 1,983.7 |
| 2020's | 1,882.4 |
| - = No Data Reported; -- = Not Applicable; NA = Not Available; W = Withheld to avoid disclosure of individual company data. |
| Release Date: 6/1/2022 |
| Next Release Date: TBD |