|
Download Data (XLS File) |
|
||||||||
|
||||||||
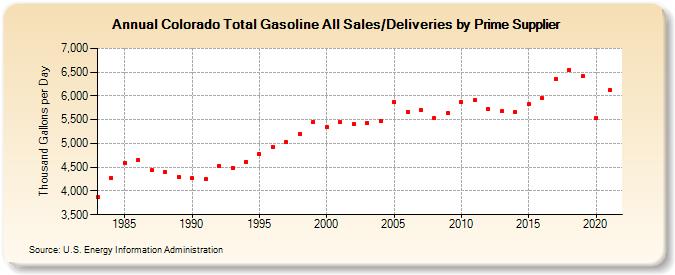
| Colorado Total Gasoline All Sales/Deliveries by Prime Supplier (Thousand Gallons per Day) | ||||||||
| Decade | Year-0 | Year-1 | Year-2 | Year-3 | Year-4 | Year-5 | Year-6 | Year-7 | Year-8 | Year-9 |
|---|---|---|---|---|---|---|---|---|---|---|
| 1980's | 3,869.4 | 4,273.5 | 4,596.6 | 4,652.9 | 4,440.5 | 4,399.3 | 4,292.9 | |||
| 1990's | 4,268.0 | 4,245.3 | 4,532.5 | 4,489.3 | 4,618.1 | 4,778.2 | 4,934.7 | 5,028.4 | 5,200.5 | 5,448.6 |
| 2000's | 5,345.6 | 5,444.5 | 5,406.6 | 5,425.7 | 5,477.3 | 5,867.0 | 5,670.0 | 5,697.0 | 5,526.1 | 5,637.2 |
| 2010's | 5,862.7 | 5,908.2 | 5,722.7 | 5,674.2 | 5,665.7 | 5,828.9 | 5,945.7 | 6,364.6 | 6,547.2 | 6,411.7 |
| 2020's | 5,537.1 |
| - = No Data Reported; -- = Not Applicable; NA = Not Available; W = Withheld to avoid disclosure of individual company data. |
| Release Date: 6/1/2022 |
| Next Release Date: TBD |