|
Download Data (XLS File) |
|
||||||||
|
||||||||
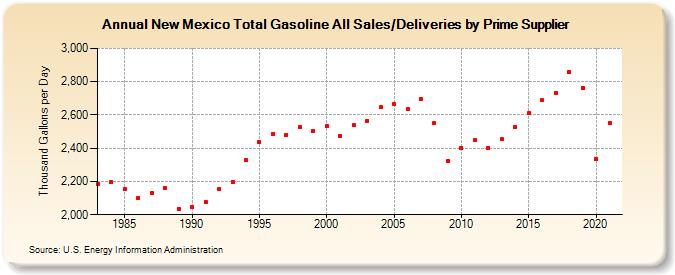
| New Mexico Total Gasoline All Sales/Deliveries by Prime Supplier (Thousand Gallons per Day) | ||||||||
| Decade | Year-0 | Year-1 | Year-2 | Year-3 | Year-4 | Year-5 | Year-6 | Year-7 | Year-8 | Year-9 |
|---|---|---|---|---|---|---|---|---|---|---|
| 1980's | 2,183.3 | 2,197.0 | 2,155.9 | 2,101.6 | 2,129.9 | 2,159.8 | 2,036.3 | |||
| 1990's | 2,044.8 | 2,079.3 | 2,153.4 | 2,197.5 | 2,327.5 | 2,436.7 | 2,486.5 | 2,481.1 | 2,528.5 | 2,505.1 |
| 2000's | 2,534.4 | 2,475.5 | 2,536.9 | 2,564.4 | 2,645.8 | 2,665.0 | 2,637.5 | 2,695.8 | 2,548.5 | 2,324.2 |
| 2010's | 2,401.0 | 2,446.6 | 2,403.5 | 2,453.5 | 2,529.1 | 2,611.3 | 2,687.9 | 2,733.2 | 2,856.5 | 2,763.5 |
| 2020's | 2,333.5 |
| - = No Data Reported; -- = Not Applicable; NA = Not Available; W = Withheld to avoid disclosure of individual company data. |
| Release Date: 6/1/2022 |
| Next Release Date: TBD |