|
Download Data (XLS File) |
|
||||||||
|
||||||||
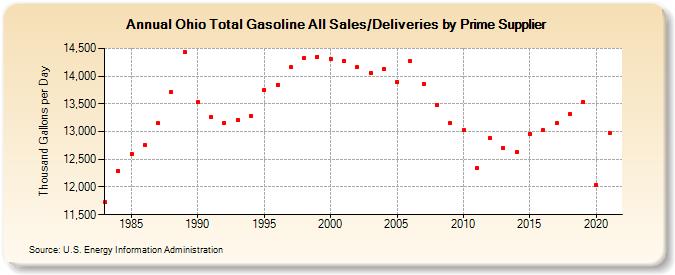
| Ohio Total Gasoline All Sales/Deliveries by Prime Supplier (Thousand Gallons per Day) | ||||||||
| Decade | Year-0 | Year-1 | Year-2 | Year-3 | Year-4 | Year-5 | Year-6 | Year-7 | Year-8 | Year-9 |
|---|---|---|---|---|---|---|---|---|---|---|
| 1980's | 11,720.8 | 12,288.7 | 12,599.8 | 12,757.9 | 13,145.5 | 13,711.9 | 14,438.6 | |||
| 1990's | 13,529.4 | 13,260.3 | 13,157.2 | 13,213.9 | 13,282.4 | 13,755.7 | 13,845.6 | 14,159.2 | 14,326.9 | 14,350.8 |
| 2000's | 14,314.6 | 14,265.7 | 14,160.0 | 14,059.7 | 14,124.9 | 13,895.5 | 14,264.6 | 13,866.5 | 13,484.1 | 13,157.5 |
| 2010's | 13,024.6 | 12,337.3 | 12,888.0 | 12,700.7 | 12,625.5 | 12,962.3 | 13,020.2 | 13,151.7 | 13,315.6 | 13,534.1 |
| 2020's | 12,037.6 |
| - = No Data Reported; -- = Not Applicable; NA = Not Available; W = Withheld to avoid disclosure of individual company data. |
| Release Date: 6/1/2022 |
| Next Release Date: TBD |