|
Download Data (XLS File) |
|
||||||||
|
||||||||
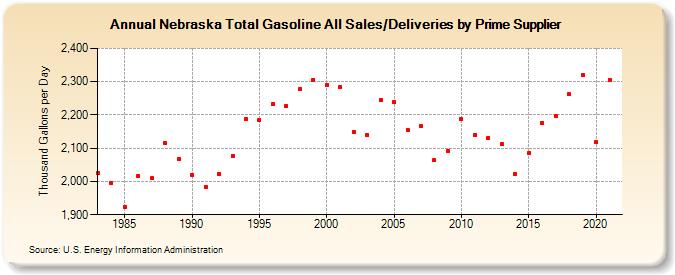
| Nebraska Total Gasoline All Sales/Deliveries by Prime Supplier (Thousand Gallons per Day) | ||||||||
| Decade | Year-0 | Year-1 | Year-2 | Year-3 | Year-4 | Year-5 | Year-6 | Year-7 | Year-8 | Year-9 |
|---|---|---|---|---|---|---|---|---|---|---|
| 1980's | 2,024.9 | 1,996.7 | 1,923.8 | 2,017.1 | 2,008.9 | 2,116.4 | 2,067.2 | |||
| 1990's | 2,019.1 | 1,984.3 | 2,023.8 | 2,078.0 | 2,187.5 | 2,184.9 | 2,232.1 | 2,227.2 | 2,278.2 | 2,306.1 |
| 2000's | 2,289.3 | 2,282.6 | 2,149.2 | 2,139.7 | 2,244.4 | 2,238.1 | 2,155.0 | 2,165.4 | 2,063.4 | 2,092.5 |
| 2010's | 2,187.4 | 2,139.7 | 2,131.8 | 2,112.4 | 2,021.1 | 2,085.0 | 2,176.9 | 2,196.5 | 2,261.7 | 2,321.4 |
| 2020's | 2,119.2 |
| - = No Data Reported; -- = Not Applicable; NA = Not Available; W = Withheld to avoid disclosure of individual company data. |
| Release Date: 6/1/2022 |
| Next Release Date: TBD |