|
Download Data (XLS File) |
|
||||||||
|
||||||||
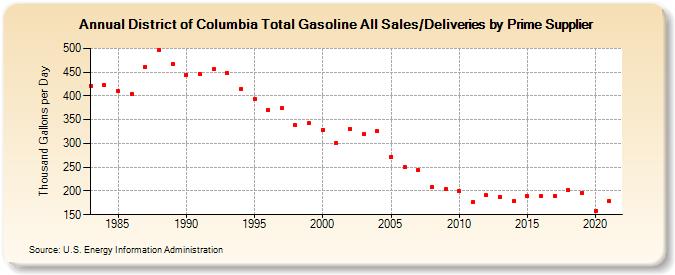
| District of Columbia Total Gasoline All Sales/Deliveries by Prime Supplier (Thousand Gallons per Day) | ||||||||
| Decade | Year-0 | Year-1 | Year-2 | Year-3 | Year-4 | Year-5 | Year-6 | Year-7 | Year-8 | Year-9 |
|---|---|---|---|---|---|---|---|---|---|---|
| 1980's | 421.8 | 422.0 | 410.8 | 404.9 | 461.7 | 497.3 | 467.2 | |||
| 1990's | 443.6 | 445.5 | 455.9 | 448.5 | 414.9 | 392.6 | 370.6 | 373.6 | 337.8 | 342.2 |
| 2000's | 328.9 | 301.8 | 330.9 | 319.1 | 325.6 | 272.5 | 249.8 | 244.5 | 208.2 | 203.3 |
| 2010's | 199.4 | 176.7 | 190.9 | 188.3 | 178.4 | 188.6 | 189.1 | 189.0 | 202.2 | 196.4 |
| 2020's | 158.7 |
| - = No Data Reported; -- = Not Applicable; NA = Not Available; W = Withheld to avoid disclosure of individual company data. |
| Release Date: 6/1/2022 |
| Next Release Date: TBD |