|
Download Data (XLS File) |
|
||||||||
|
||||||||
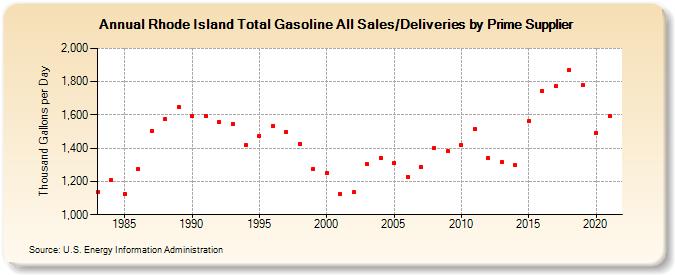
| Rhode Island Total Gasoline All Sales/Deliveries by Prime Supplier (Thousand Gallons per Day) | ||||||||
| Decade | Year-0 | Year-1 | Year-2 | Year-3 | Year-4 | Year-5 | Year-6 | Year-7 | Year-8 | Year-9 |
|---|---|---|---|---|---|---|---|---|---|---|
| 1980's | 1,138.7 | 1,208.7 | 1,126.4 | 1,272.4 | 1,506.1 | 1,572.6 | 1,648.1 | |||
| 1990's | 1,590.9 | 1,595.8 | 1,556.3 | 1,545.8 | 1,417.3 | 1,475.3 | 1,534.3 | 1,498.5 | 1,426.9 | 1,277.2 |
| 2000's | 1,249.2 | 1,124.2 | 1,134.7 | 1,302.7 | 1,342.3 | 1,311.9 | 1,228.5 | 1,286.3 | 1,401.8 | 1,380.8 |
| 2010's | 1,417.8 | 1,514.9 | 1,340.0 | 1,317.8 | 1,296.4 | 1,561.5 | 1,745.9 | 1,772.1 | 1,869.1 | 1,777.1 |
| 2020's | 1,493.5 |
| - = No Data Reported; -- = Not Applicable; NA = Not Available; W = Withheld to avoid disclosure of individual company data. |
| Release Date: 6/1/2022 |
| Next Release Date: TBD |