|
Download Data (XLS File) |
|
||||||||
|
||||||||
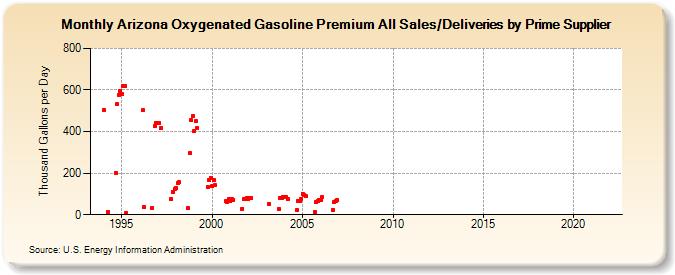
| Arizona Oxygenated Gasoline Premium All Sales/Deliveries by Prime Supplier (Thousand Gallons per Day) | ||||||||
| Year | Jan | Feb | Mar | Apr | May | Jun | Jul | Aug | Sep | Oct | Nov | Dec |
|---|---|---|---|---|---|---|---|---|---|---|---|---|
| 1993 | NA | NA | NA | |||||||||
| 1994 | 504.2 | W | W | 14.4 | W | W | W | W | 202.8 | 531.3 | 578.1 | 594.1 |
| 1995 | 581.8 | 620.7 | 617.9 | 9.1 | W | W | W | W | W | W | W | W |
| 1996 | W | W | 502.4 | 37.3 | W | - | W | W | 33.4 | W | 426.0 | 442.4 |
| 1997 | 440.0 | 440.3 | 419.4 | W | W | W | W | W | W | 76.3 | 110.9 | 124.7 |
| 1998 | 127.4 | 150.4 | 155.4 | W | - | - | W | W | 29.9 | 295.1 | 454.6 | 473.2 |
| 1999 | 400.8 | 451.4 | 417.8 | W | - | - | - | - | W | 134.8 | 166.5 | 178.0 |
| 2000 | 136.8 | 166.3 | 142.6 | - | - | - | - | - | W | 64.3 | 62.6 | 74.5 |
| 2001 | 65.7 | 73.4 | 71.7 | - | - | - | - | - | 28.8 | 74.1 | 75.4 | 81.8 |
| 2002 | 76.3 | 81.5 | 79.5 | - | - | - | - | - | W | W | W | W |
| 2003 | W | W | 53.1 | - | - | - | - | - | 28.0 | 81.0 | 81.5 | 86.3 |
| 2004 | 86.0 | 86.1 | 74.5 | W | - | - | - | - | 22.0 | 68.0 | 67.1 | 75.6 |
| 2005 | 102.0 | 95.3 | 89.0 | - | - | - | - | - | 15.1 | 59.4 | 67.2 | 71.0 |
| 2006 | 69.8 | 84.4 | W | - | - | - | - | - | 22.4 | 62.2 | 65.0 | 69.9 |
| 2007 | - | - | - | - | - | - | - | - | - | - | - | - |
| 2008 | - | - | - | - | - | - | - | - | - | - | - | - |
| 2009 | - | - | - | - | - | - | - | - | - | - | - | - |
| 2010 | - | - | - | - | - | - | - | - | - | - | - | - |
| 2011 | - | - | - | - | - | - | - | - | - | - | - | - |
| 2012 | - | - | - | - | - | - | - | - | - | - | - | - |
| 2013 | - | - | - | - | - | - | - | - | - | - | - | - |
| 2014 | - | - | - | - | - | - | - | - | - | - | - | - |
| 2015 | - | - | - | - | - | - | - | - | - | - | - | - |
| 2016 | - | - | - | - | - | - | - | - | - | - | - | - |
| 2017 | - | - | - | - | - | - | - | - | - | - | - | - |
| 2018 | - | - | - | - | - | - | - | - | - | - | - | - |
| 2019 | - | - | - | - | - | - | - | - | - | - | - | - |
| 2020 | - | - | - | - | - | - | - | - | - | - | - | - |
| 2021 | - | - | - | - | - | - | - | - | - | - | - | - |
| 2022 | - | - | - | |||||||||
| - = No Data Reported; -- = Not Applicable; NA = Not Available; W = Withheld to avoid disclosure of individual company data. |
| Release Date: 5/19/2022 |
| Next Release Date: TBD |