|
Download Data (XLS File) |
|
||||||||
|
||||||||
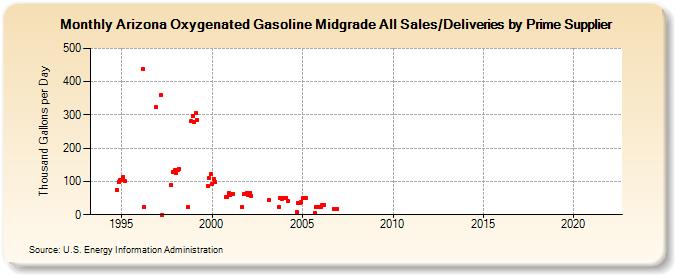
| Arizona Oxygenated Gasoline Midgrade All Sales/Deliveries by Prime Supplier (Thousand Gallons per Day) | ||||||||
| Year | Jan | Feb | Mar | Apr | May | Jun | Jul | Aug | Sep | Oct | Nov | Dec |
|---|---|---|---|---|---|---|---|---|---|---|---|---|
| 1993 | NA | NA | NA | |||||||||
| 1994 | W | W | W | - | - | - | - | - | - | 73.6 | 98.5 | 104.7 |
| 1995 | 102.9 | 112.9 | 101.4 | W | - | - | - | - | W | W | W | W |
| 1996 | W | W | 437.1 | 22.1 | W | - | - | - | W | W | W | 322.4 |
| 1997 | W | W | 360.3 | 0.6 | - | - | - | - | W | 88.1 | 127.6 | 133.4 |
| 1998 | 126.0 | 134.4 | 137.7 | W | - | - | - | - | 22.4 | W | 280.4 | 296.9 |
| 1999 | 280.0 | 305.4 | 285.8 | W | - | - | - | - | W | 86.9 | 109.1 | 121.6 |
| 2000 | 91.5 | 108.6 | 98.1 | - | - | - | - | - | W | 53.5 | 53.8 | 63.9 |
| 2001 | 59.1 | 61.3 | 63.6 | - | - | - | - | - | 23.6 | 62.8 | 62.6 | 65.0 |
| 2002 | 59.8 | 65.4 | 57.7 | - | - | - | - | - | W | W | W | W |
| 2003 | W | W | 45.4 | - | - | - | - | - | 23.8 | 49.8 | 48.2 | 50.3 |
| 2004 | 49.0 | 51.7 | 42.3 | W | - | - | - | - | 7.5 | 35.7 | 34.8 | 37.6 |
| 2005 | 49.0 | 51.4 | 48.8 | - | - | - | - | - | 5.3 | 21.8 | 21.8 | 24.1 |
| 2006 | 23.5 | 29.1 | 29.3 | - | - | - | - | - | W | 18.5 | 17.4 | 18.1 |
| 2007 | - | - | - | - | - | - | - | - | - | - | - | - |
| 2008 | - | - | - | - | - | - | - | - | - | - | - | - |
| 2009 | - | - | - | - | - | - | - | - | - | - | - | - |
| 2010 | - | - | - | - | - | - | - | - | - | - | - | - |
| 2011 | - | - | - | - | - | - | - | - | - | - | - | - |
| 2012 | - | - | - | - | - | - | - | - | - | - | - | - |
| 2013 | - | - | - | - | - | - | - | - | - | - | - | - |
| 2014 | - | - | - | - | - | - | - | - | - | - | - | - |
| 2015 | - | - | - | - | - | - | - | - | - | - | - | - |
| 2016 | - | - | - | - | - | - | - | - | - | - | - | - |
| 2017 | - | - | - | - | - | - | - | - | - | - | - | - |
| 2018 | - | - | - | - | - | - | - | - | - | - | - | - |
| 2019 | - | - | - | - | - | - | - | - | - | - | - | - |
| 2020 | - | - | - | - | - | - | - | - | - | - | - | - |
| 2021 | - | - | - | - | - | - | - | - | - | - | - | - |
| 2022 | - | - | - | |||||||||
| - = No Data Reported; -- = Not Applicable; NA = Not Available; W = Withheld to avoid disclosure of individual company data. |
| Release Date: 5/19/2022 |
| Next Release Date: TBD |