|
Download Data (XLS File) |
|
||||||||
|
||||||||
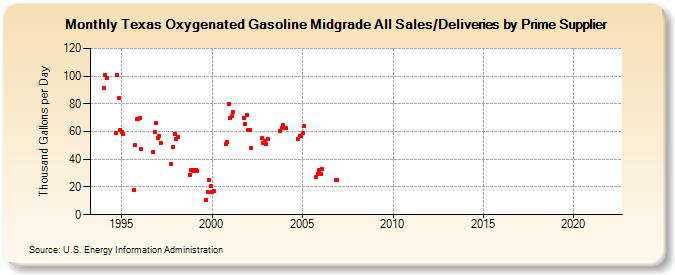
| Texas Oxygenated Gasoline Midgrade All Sales/Deliveries by Prime Supplier (Thousand Gallons per Day) | ||||||||
| Year | Jan | Feb | Mar | Apr | May | Jun | Jul | Aug | Sep | Oct | Nov | Dec |
|---|---|---|---|---|---|---|---|---|---|---|---|---|
| 1993 | NA | NA | NA | |||||||||
| 1994 | 91.5 | 100.6 | 98.5 | W | W | W | W | W | 58.8 | 100.8 | 84.1 | 60.9 |
| 1995 | 59.7 | 58.1 | W | W | - | - | - | - | 18.0 | 50.2 | 68.8 | 69.4 |
| 1996 | 69.5 | 47.3 | W | W | - | - | - | - | W | 45.4 | 59.6 | 66.2 |
| 1997 | 55.6 | 56.9 | 51.7 | W | - | - | - | - | W | 36.3 | 48.5 | 58.3 |
| 1998 | 54.5 | 56.3 | W | - | - | - | - | - | W | 29.0 | 32.2 | 31.9 |
| 1999 | 32.6 | 32.0 | 31.6 | W | - | - | - | - | 10.8 | 16.6 | 25.2 | 20.6 |
| 2000 | 16.4 | 16.8 | W | W | - | - | - | - | W | 51.1 | 52.7 | 80.1 |
| 2001 | 69.5 | 70.9 | 73.9 | W | - | - | - | - | W | 69.9 | 65.8 | 71.6 |
| 2002 | 61.0 | 61.3 | 47.8 | - | - | - | - | - | W | 55.5 | 51.7 | 53.4 |
| 2003 | 50.9 | 54.5 | W | - | - | - | - | - | W | 60.7 | 62.3 | 64.5 |
| 2004 | 62.5 | 62.7 | W | - | - | - | - | - | W | 54.6 | 56.7 | 56.8 |
| 2005 | 58.7 | 63.9 | W | - | - | - | - | - | W | 27.3 | 29.7 | 32.2 |
| 2006 | 29.6 | 33.1 | W | - | - | - | - | - | W | W | 24.8 | 24.7 |
| 2007 | - | - | - | - | - | - | - | - | - | - | - | - |
| 2008 | - | - | - | - | - | - | - | - | - | - | - | - |
| 2009 | - | - | - | - | - | - | - | - | - | - | - | - |
| 2010 | - | - | - | - | - | - | - | - | - | - | - | - |
| 2011 | - | - | - | - | - | - | - | - | - | - | - | - |
| 2012 | - | - | - | - | - | - | - | - | - | - | - | - |
| 2013 | - | - | - | - | - | - | - | - | - | - | - | - |
| 2014 | - | - | - | - | - | - | - | - | - | - | - | - |
| 2015 | - | - | - | - | - | - | - | - | - | - | - | - |
| 2016 | - | - | - | - | - | - | - | - | - | - | - | - |
| 2017 | - | - | - | - | - | - | - | - | - | - | - | - |
| 2018 | - | - | - | - | - | - | - | - | - | - | - | - |
| 2019 | - | - | - | - | - | - | - | - | - | - | - | - |
| 2020 | - | - | - | - | - | - | - | - | - | - | - | - |
| 2021 | - | - | - | - | - | - | - | - | - | - | - | - |
| 2022 | - | - | - | |||||||||
| - = No Data Reported; -- = Not Applicable; NA = Not Available; W = Withheld to avoid disclosure of individual company data. |
| Release Date: 5/19/2022 |
| Next Release Date: TBD |