|
Download Data (XLS File) |
|
||||||||
|
||||||||
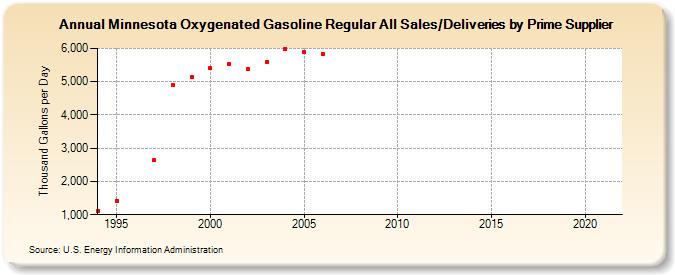
| Minnesota Oxygenated Gasoline Regular All Sales/Deliveries by Prime Supplier (Thousand Gallons per Day) | ||||||||
| Decade | Year-0 | Year-1 | Year-2 | Year-3 | Year-4 | Year-5 | Year-6 | Year-7 | Year-8 | Year-9 |
|---|---|---|---|---|---|---|---|---|---|---|
| 1990's | 1,107.2 | 1,420.8 | W | 2,631.3 | 4,884.7 | 5,135.1 | ||||
| 2000's | 5,400.4 | 5,524.7 | 5,387.1 | 5,585.0 | 5,985.9 | 5,902.0 | 5,845.6 | - | - | - |
| 2010's | - | - | - | - | - | - | - | - | - | - |
| 2020's | - |
| - = No Data Reported; -- = Not Applicable; NA = Not Available; W = Withheld to avoid disclosure of individual company data. |
| Release Date: 6/1/2022 |
| Next Release Date: TBD |