|
Download Data (XLS File) |
|
||||||||
|
||||||||
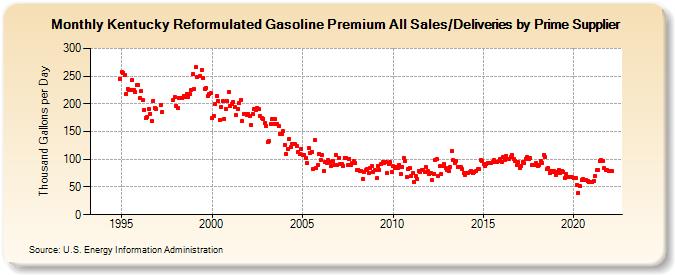
| Kentucky Reformulated Gasoline Premium All Sales/Deliveries by Prime Supplier (Thousand Gallons per Day) | ||||||||
| Year | Jan | Feb | Mar | Apr | May | Jun | Jul | Aug | Sep | Oct | Nov | Dec |
|---|---|---|---|---|---|---|---|---|---|---|---|---|
| 1993 | - | - | - | |||||||||
| 1994 | - | - | - | - | - | - | - | - | - | - | W | 245.1 |
| 1995 | 258.0 | 256.1 | 251.5 | 218.1 | 226.1 | 225.5 | 224.2 | 242.7 | 225.6 | 220.6 | 233.9 | 233.2 |
| 1996 | 210.2 | 223.4 | 206.1 | 188.9 | 174.7 | 176.4 | 191.1 | 182.4 | 169.8 | 205.6 | 191.9 | 190.8 |
| 1997 | W | W | 198.5 | 185.5 | W | W | W | W | W | W | 206.1 | 212.2 |
| 1998 | 196.9 | 193.3 | 210.6 | 210.2 | 210.7 | 214.7 | 211.8 | 218.2 | 212.3 | 218.0 | 224.2 | 253.8 |
| 1999 | 226.9 | 266.2 | 247.7 | W | 250.0 | 261.8 | 246.2 | 227.3 | 228.8 | 214.4 | 217.3 | 219.5 |
| 2000 | 174.0 | 178.1 | 199.4 | 214.0 | 205.3 | 171.3 | 194.8 | 204.6 | 173.3 | 191.5 | 204.5 | 221.6 |
| 2001 | 195.8 | 200.5 | 203.7 | 194.4 | 179.2 | 190.9 | 201.8 | 207.5 | 168.5 | 181.8 | 182.2 | 180.4 |
| 2002 | 181.6 | 178.3 | 162.7 | 182.2 | 190.4 | 188.5 | 192.9 | 190.3 | 178.0 | 174.1 | 173.2 | 166.0 |
| 2003 | 159.3 | 131.9 | 132.5 | 162.9 | 172.0 | 164.1 | 171.9 | 164.2 | 159.5 | 146.2 | 146.1 | 150.4 |
| 2004 | 126.4 | 109.1 | 118.5 | 137.4 | 121.8 | 128.3 | 127.2 | 127.1 | 123.9 | 113.5 | 109.6 | 118.2 |
| 2005 | 107.3 | 108.2 | 102.7 | 93.0 | 120.4 | 112.1 | 113.2 | 83.0 | 134.5 | 84.9 | 89.8 | 109.7 |
| 2006 | 99.2 | 107.4 | 79.4 | 94.5 | 93.4 | 99.4 | 95.8 | 87.7 | 96.4 | 89.8 | 108.1 | 90.2 |
| 2007 | 102.7 | 91.3 | 90.8 | 88.0 | 102.4 | 102.6 | 88.8 | 100.2 | 89.2 | 93.6 | 97.0 | 93.6 |
| 2008 | 80.5 | 81.3 | 78.9 | 78.1 | 64.7 | 77.7 | 80.5 | 82.2 | 75.3 | 84.3 | 87.0 | 76.4 |
| 2009 | 79.9 | 65.6 | 87.9 | 80.6 | 90.8 | 95.4 | 93.8 | 94.4 | 74.5 | 91.4 | 94.4 | 77.8 |
| 2010 | 87.4 | 84.4 | 85.4 | 84.6 | 90.5 | 74.1 | 85.5 | 102.5 | 96.6 | 68.0 | 81.8 | 84.9 |
| 2011 | 70.4 | 75.0 | 59.9 | 69.7 | 64.9 | 78.3 | 77.6 | 80.5 | 81.0 | 77.9 | 85.9 | 78.7 |
| 2012 | 73.5 | 75.0 | 61.8 | 73.9 | 97.9 | 100.0 | 70.7 | 87.8 | 73.5 | 87.3 | 91.3 | 84.0 |
| 2013 | 81.3 | 78.4 | 85.6 | 115.0 | 98.2 | 93.8 | 96.8 | 85.7 | 86.4 | 86.0 | 81.6 | 74.7 |
| 2014 | 72.3 | 75.0 | 75.8 | 76.2 | 79.4 | 74.5 | 76.3 | 78.7 | 82.0 | 83.3 | 98.3 | 96.2 |
| 2015 | 91.2 | 88.3 | 90.6 | 93.7 | 93.9 | 92.4 | 95.0 | 98.4 | 95.2 | 94.3 | 96.1 | 100.5 |
| 2016 | 95.5 | 103.6 | 98.6 | 106.5 | 100.9 | 101.3 | 103.2 | 107.7 | 101.3 | 97.1 | 89.2 | 94.5 |
| 2017 | 84.3 | 87.1 | 95.1 | 92.9 | 101.0 | 104.8 | 100.2 | 102.0 | 88.9 | 89.7 | 89.4 | 93.7 |
| 2018 | 87.3 | 90.5 | 97.4 | 94.1 | 108.4 | 103.8 | 81.6 | 84.4 | 75.7 | 79.5 | 77.5 | 78.4 |
| 2019 | 71.9 | 76.5 | 80.8 | 75.1 | 78.9 | 77.4 | 66.7 | 73.0 | 68.8 | 67.3 | 67.7 | 67.5 |
| 2020 | 66.5 | 66.6 | 54.0 | 39.8 | 51.2 | 62.3 | 64.9 | 62.5 | 62.7 | 61.6 | 58.3 | 59.5 |
| 2021 | 58.2 | 61.4 | 69.5 | 79.8 | 81.2 | 96.3 | 98.7 | 96.8 | 83.8 | 80.7 | 80.6 | 78.4 |
| 2022 | 78.9 | 79.2 | W | |||||||||
| - = No Data Reported; -- = Not Applicable; NA = Not Available; W = Withheld to avoid disclosure of individual company data. |
| Release Date: 5/19/2022 |
| Next Release Date: TBD |