|
Download Data (XLS File) |
|
||||||||
|
||||||||
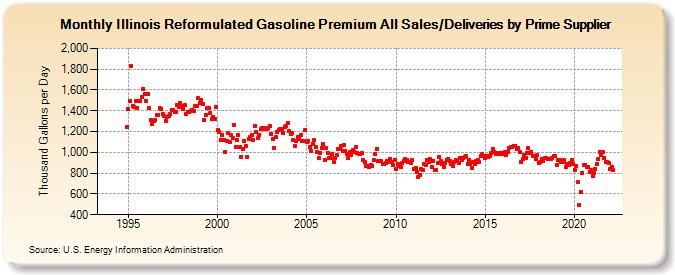
| Illinois Reformulated Gasoline Premium All Sales/Deliveries by Prime Supplier (Thousand Gallons per Day) | ||||||||
| Year | Jan | Feb | Mar | Apr | May | Jun | Jul | Aug | Sep | Oct | Nov | Dec |
|---|---|---|---|---|---|---|---|---|---|---|---|---|
| 1993 | - | - | - | |||||||||
| 1994 | - | - | - | - | - | - | - | - | - | - | W | 1,241.9 |
| 1995 | 1,412.7 | 1,494.7 | 1,828.9 | 1,448.3 | 1,433.3 | 1,496.8 | 1,431.2 | 1,496.7 | 1,492.9 | 1,532.3 | 1,610.5 | 1,558.0 |
| 1996 | 1,493.5 | 1,564.0 | 1,421.9 | 1,309.9 | 1,277.4 | 1,305.4 | 1,315.7 | 1,358.2 | 1,363.9 | 1,424.5 | 1,417.9 | 1,368.3 |
| 1997 | 1,347.1 | 1,302.3 | 1,338.3 | 1,346.0 | 1,364.5 | 1,407.0 | 1,404.8 | 1,383.5 | 1,383.7 | 1,453.7 | 1,434.9 | 1,477.0 |
| 1998 | 1,444.5 | 1,420.6 | 1,454.1 | 1,367.5 | 1,386.0 | 1,385.0 | 1,398.9 | 1,410.9 | 1,397.7 | 1,445.2 | 1,444.7 | 1,518.2 |
| 1999 | 1,477.5 | 1,501.9 | 1,461.5 | 1,309.7 | 1,361.6 | 1,421.8 | 1,430.1 | 1,374.4 | 1,318.2 | 1,339.3 | 1,319.9 | 1,437.5 |
| 2000 | 1,212.2 | 1,197.1 | 1,122.0 | 1,170.5 | 1,117.7 | 1,002.1 | 1,110.2 | 1,183.1 | 1,101.4 | 1,163.1 | 1,141.4 | 1,266.3 |
| 2001 | 1,054.1 | 1,118.1 | 1,165.5 | 1,047.9 | 958.7 | 1,030.2 | 1,104.7 | 1,056.3 | 958.9 | 1,130.1 | 1,151.4 | 1,169.9 |
| 2002 | 1,117.5 | 1,256.0 | 1,199.1 | 1,136.0 | 1,164.6 | 1,219.9 | 1,234.0 | 1,231.0 | 1,222.2 | 1,225.8 | 1,235.5 | 1,250.9 |
| 2003 | 1,175.5 | 1,127.9 | 1,041.4 | 1,143.4 | 1,192.0 | 1,219.3 | 1,228.0 | 1,220.6 | 1,186.4 | 1,241.8 | 1,256.4 | 1,286.4 |
| 2004 | 1,208.2 | 1,172.8 | 1,182.7 | 1,117.5 | 1,059.2 | 1,112.4 | 1,143.4 | 1,130.7 | 1,169.3 | 1,106.9 | 1,105.5 | 1,216.9 |
| 2005 | 1,098.2 | 1,106.7 | 1,047.0 | 1,013.0 | 1,082.8 | 1,114.9 | 1,049.1 | 1,006.6 | 942.1 | 995.2 | 1,042.6 | 1,079.0 |
| 2006 | 929.9 | 1,046.4 | 991.3 | 949.2 | 946.7 | 981.2 | 903.6 | 944.7 | 969.9 | 1,034.1 | 1,029.4 | 1,057.5 |
| 2007 | 1,012.9 | 1,066.9 | 1,017.0 | 985.0 | 941.1 | 1,004.1 | 976.2 | 1,022.2 | 1,007.3 | 1,049.3 | 989.6 | 987.9 |
| 2008 | 983.5 | 995.7 | 927.6 | 910.5 | 870.4 | 866.2 | 856.3 | 881.5 | 870.5 | 922.3 | 983.0 | 1,035.2 |
| 2009 | 914.2 | 915.3 | 912.0 | 886.2 | 890.5 | 901.5 | 914.5 | 904.1 | 939.9 | 911.6 | 880.8 | 927.0 |
| 2010 | 840.1 | 884.5 | 870.9 | 859.8 | 895.6 | 917.8 | 933.7 | 928.9 | 902.7 | 910.8 | 899.4 | 927.4 |
| 2011 | 836.5 | 849.4 | 814.4 | 767.2 | 782.9 | 839.6 | 825.7 | 885.2 | 879.1 | 928.5 | 904.9 | 933.4 |
| 2012 | 860.4 | 918.5 | 834.9 | 834.0 | 897.8 | 953.9 | 913.9 | 884.7 | 861.1 | 899.4 | 926.7 | 939.8 |
| 2013 | 916.2 | 884.4 | 872.4 | 904.4 | 922.6 | 912.0 | 898.9 | 941.1 | 923.4 | 943.6 | 956.3 | 960.1 |
| 2014 | 892.4 | 924.5 | 890.7 | 848.3 | 904.2 | 889.8 | 916.8 | 926.0 | 909.0 | 963.5 | 985.3 | 969.2 |
| 2015 | 941.1 | 961.2 | 957.9 | 966.6 | 990.3 | 1,027.8 | 998.6 | 983.6 | 994.4 | 982.0 | 997.0 | 980.9 |
| 2016 | 989.5 | 1,003.6 | 978.1 | 1,004.0 | 1,045.5 | 1,055.6 | 1,046.6 | 1,062.0 | 1,064.5 | 1,032.8 | 1,041.3 | 1,000.7 |
| 2017 | 903.6 | 936.9 | 971.2 | 946.4 | 995.8 | 1,046.0 | 995.9 | 1,005.3 | 966.2 | 967.7 | 936.4 | 977.6 |
| 2018 | 899.6 | 906.6 | 940.4 | 912.5 | 943.0 | 945.1 | 933.2 | 938.3 | 940.1 | 946.4 | 960.1 | 967.1 |
| 2019 | 873.7 | 930.8 | 927.5 | 902.3 | 905.3 | 927.2 | 860.5 | 887.7 | 875.2 | 900.9 | 925.1 | 892.5 |
| 2020 | 833.2 | 872.5 | 712.7 | 493.8 | 617.1 | 802.4 | 877.8 | 879.0 | 859.2 | 863.3 | 806.5 | 825.6 |
| 2021 | 767.9 | 798.8 | 835.5 | 886.5 | 938.0 | 1,002.3 | 969.9 | 1,003.9 | 948.8 | 904.0 | 909.4 | 896.5 |
| 2022 | 838.0 | 859.1 | 827.4 | |||||||||
| - = No Data Reported; -- = Not Applicable; NA = Not Available; W = Withheld to avoid disclosure of individual company data. |
| Release Date: 5/19/2022 |
| Next Release Date: TBD |