|
Download Data (XLS File) |
|
||||||||
|
||||||||
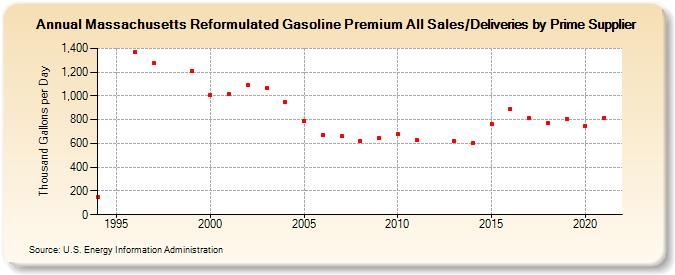
| Massachusetts Reformulated Gasoline Premium All Sales/Deliveries by Prime Supplier (Thousand Gallons per Day) | ||||||||
| Decade | Year-0 | Year-1 | Year-2 | Year-3 | Year-4 | Year-5 | Year-6 | Year-7 | Year-8 | Year-9 |
|---|---|---|---|---|---|---|---|---|---|---|
| 1990's | 147.6 | W | 1,365.8 | 1,273.5 | W | 1,207.7 | ||||
| 2000's | 1,007.9 | 1,016.8 | 1,095.4 | 1,062.5 | 945.2 | 792.2 | 672.9 | 662.4 | 621.7 | 645.7 |
| 2010's | 677.6 | 632.7 | W | 619.8 | 600.6 | 767.5 | 887.6 | 814.8 | 774.0 | 806.6 |
| 2020's | 749.8 |
| - = No Data Reported; -- = Not Applicable; NA = Not Available; W = Withheld to avoid disclosure of individual company data. |
| Release Date: 6/1/2022 |
| Next Release Date: TBD |