|
Download Data (XLS File) |
|
||||||||
|
||||||||
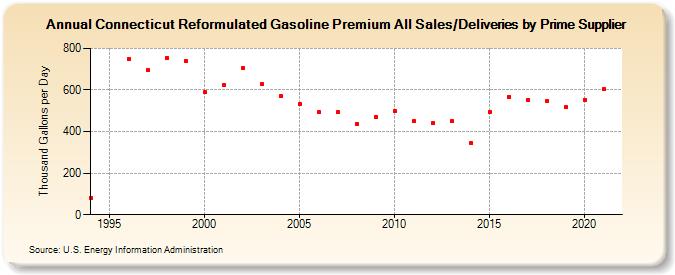
| Connecticut Reformulated Gasoline Premium All Sales/Deliveries by Prime Supplier (Thousand Gallons per Day) | ||||||||
| Decade | Year-0 | Year-1 | Year-2 | Year-3 | Year-4 | Year-5 | Year-6 | Year-7 | Year-8 | Year-9 |
|---|---|---|---|---|---|---|---|---|---|---|
| 1990's | 81.9 | W | 750.0 | 694.5 | 754.2 | 738.6 | ||||
| 2000's | 588.3 | 626.0 | 705.1 | 628.3 | 570.7 | 533.5 | 492.5 | 493.9 | 436.8 | 471.0 |
| 2010's | 498.8 | 449.0 | 439.1 | 449.3 | 344.7 | 494.8 | 567.2 | 551.6 | 544.6 | 517.9 |
| 2020's | 552.7 |
| - = No Data Reported; -- = Not Applicable; NA = Not Available; W = Withheld to avoid disclosure of individual company data. |
| Release Date: 6/1/2022 |
| Next Release Date: TBD |