|
Download Data (XLS File) |
|
||||||||
|
||||||||
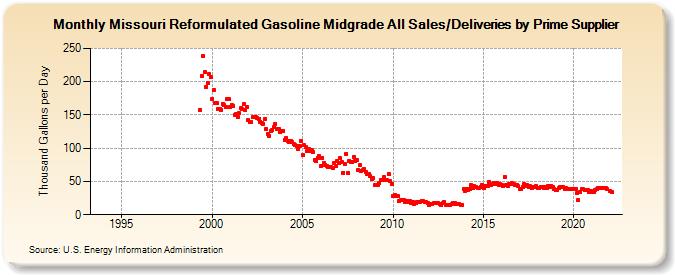
| Missouri Reformulated Gasoline Midgrade All Sales/Deliveries by Prime Supplier (Thousand Gallons per Day) | ||||||||
| Year | Jan | Feb | Mar | Apr | May | Jun | Jul | Aug | Sep | Oct | Nov | Dec |
|---|---|---|---|---|---|---|---|---|---|---|---|---|
| 1993 | - | - | - | |||||||||
| 1994 | - | - | - | - | - | - | - | - | - | - | - | - |
| 1995 | - | - | - | - | - | - | - | - | - | - | - | - |
| 1996 | - | - | - | - | - | - | - | - | - | - | - | - |
| 1997 | - | - | - | - | - | - | - | - | - | - | - | - |
| 1998 | - | - | - | - | - | - | - | - | - | - | - | - |
| 1999 | - | - | - | W | 157.4 | 209.1 | 238.1 | 214.4 | 192.7 | 198.0 | 211.2 | 206.6 |
| 2000 | 174.0 | 187.4 | 168.1 | 167.3 | 159.6 | 158.3 | 157.6 | 166.8 | 164.2 | 162.5 | 174.1 | 173.3 |
| 2001 | 161.2 | 164.8 | 163.5 | 149.9 | 151.6 | 147.6 | 152.3 | 159.9 | 159.0 | 165.8 | 157.8 | 162.1 |
| 2002 | 142.9 | 139.1 | 138.9 | 146.4 | 147.3 | 147.0 | 145.2 | 144.3 | 139.9 | 137.9 | 137.1 | 144.0 |
| 2003 | 128.5 | 121.1 | 118.4 | 126.0 | 126.6 | 131.8 | 136.6 | 129.2 | 129.0 | 124.7 | 125.3 | 126.5 |
| 2004 | 112.0 | 115.4 | 111.5 | 109.7 | 110.6 | 109.2 | 105.9 | 104.5 | 103.5 | 98.7 | 102.7 | 110.3 |
| 2005 | 89.6 | 104.1 | 101.5 | 95.1 | 99.1 | 95.9 | 96.9 | 93.6 | 82.7 | 80.2 | 85.8 | 88.3 |
| 2006 | 72.5 | 85.5 | 77.7 | 74.9 | 73.8 | 72.0 | 72.2 | 71.1 | 69.6 | 77.8 | 72.7 | 81.2 |
| 2007 | 78.0 | 84.8 | 79.2 | 63.4 | 75.9 | 92.0 | 62.9 | 81.1 | 79.4 | 78.5 | 87.5 | 80.5 |
| 2008 | 81.7 | 67.3 | 74.0 | 66.0 | 66.6 | 68.0 | 64.9 | 60.5 | 60.5 | 58.5 | 53.9 | 54.8 |
| 2009 | 45.2 | 45.1 | 45.3 | 47.8 | 52.2 | 52.2 | 56.1 | 51.9 | 51.8 | 61.4 | 50.6 | 45.7 |
| 2010 | 27.6 | 29.4 | 28.1 | 28.8 | 20.0 | 21.5 | 21.9 | 21.4 | 19.1 | 20.4 | 19.8 | 20.0 |
| 2011 | 17.7 | 18.6 | 16.4 | 17.3 | 18.7 | 18.8 | 18.5 | 20.3 | 20.1 | 19.0 | 18.4 | 17.8 |
| 2012 | 15.1 | 15.9 | 15.7 | 16.9 | 17.5 | 17.4 | 17.2 | 15.6 | 14.5 | 17.2 | 18.8 | 15.1 |
| 2013 | 13.9 | 13.9 | 14.8 | 15.9 | 16.9 | 17.0 | 16.5 | 15.8 | 15.4 | 14.7 | 15.0 | 38.7 |
| 2014 | 36.1 | 37.9 | 37.5 | 37.9 | 44.6 | 40.5 | 43.4 | 42.3 | 40.6 | 40.8 | 42.3 | 45.3 |
| 2015 | 40.0 | 43.7 | 42.8 | 43.5 | 49.0 | 45.4 | 46.7 | 47.8 | 46.6 | 47.6 | 44.6 | 45.8 |
| 2016 | 45.2 | 43.0 | 57.3 | 45.2 | 43.1 | 46.1 | 45.6 | 47.2 | 46.7 | 44.6 | 44.5 | 42.6 |
| 2017 | 39.3 | 39.1 | 41.1 | 45.6 | 42.6 | 44.6 | 41.7 | 42.7 | 40.7 | 41.6 | 41.9 | 43.0 |
| 2018 | 40.7 | 40.5 | 42.3 | 41.9 | 40.7 | 41.7 | 39.5 | 42.8 | 41.1 | 43.7 | 41.1 | 39.1 |
| 2019 | 36.4 | 37.5 | 39.6 | 41.0 | 41.7 | 41.1 | 39.2 | 39.7 | 39.4 | 39.2 | 38.3 | 38.6 |
| 2020 | 38.2 | 38.8 | 31.9 | 22.4 | 33.5 | 38.1 | 38.2 | 37.5 | 36.9 | 37.7 | 34.7 | 36.1 |
| 2021 | 34.3 | 33.6 | 37.1 | 38.6 | 40.6 | 40.7 | 40.9 | 40.1 | 40.0 | 39.6 | 38.3 | W |
| 2022 | 35.1 | 33.7 | W | |||||||||
| - = No Data Reported; -- = Not Applicable; NA = Not Available; W = Withheld to avoid disclosure of individual company data. |
| Release Date: 5/19/2022 |
| Next Release Date: TBD |