|
Download Data (XLS File) |
|
||||||||
|
||||||||
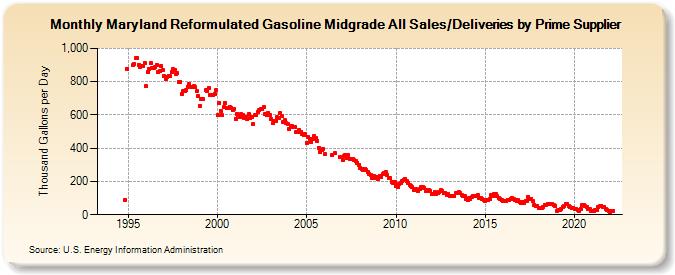
| Maryland Reformulated Gasoline Midgrade All Sales/Deliveries by Prime Supplier (Thousand Gallons per Day) | ||||||||
| Year | Jan | Feb | Mar | Apr | May | Jun | Jul | Aug | Sep | Oct | Nov | Dec |
|---|---|---|---|---|---|---|---|---|---|---|---|---|
| 1993 | - | - | - | |||||||||
| 1994 | - | - | - | - | - | - | - | - | - | - | 91.2 | 877.2 |
| 1995 | W | W | W | 898.2 | 908.8 | 944.9 | 943.2 | 902.5 | 888.6 | 897.0 | 893.4 | 913.0 |
| 1996 | 772.2 | 859.3 | 878.1 | 911.6 | 884.4 | 882.3 | 887.6 | 902.9 | 857.5 | 862.7 | 892.9 | 869.5 |
| 1997 | 832.5 | 817.4 | 830.6 | 832.5 | 833.3 | 858.4 | 873.5 | 867.2 | 844.2 | 852.9 | 799.8 | 800.5 |
| 1998 | 727.6 | 743.6 | 741.1 | 748.6 | 769.5 | 785.5 | W | 766.3 | 772.5 | 765.4 | 741.9 | 713.4 |
| 1999 | 655.2 | 697.1 | 695.4 | W | 747.6 | 745.5 | 762.1 | 716.9 | 720.3 | 719.5 | 725.3 | 747.9 |
| 2000 | 598.1 | 670.0 | 624.1 | 597.4 | 647.3 | 673.5 | 640.2 | 641.7 | 645.9 | 641.9 | 627.8 | 637.2 |
| 2001 | 577.5 | 607.8 | 599.9 | 585.9 | 605.4 | 598.5 | 584.4 | 586.4 | 575.1 | 604.3 | 578.7 | 587.2 |
| 2002 | 544.4 | 596.6 | 597.5 | 619.2 | 629.1 | 632.8 | 637.5 | 644.9 | 607.8 | 596.9 | 613.1 | 601.6 |
| 2003 | 576.5 | 548.9 | 563.4 | 562.7 | 586.7 | 581.9 | 611.4 | 594.2 | 556.4 | 566.6 | 549.4 | 543.6 |
| 2004 | 515.4 | 533.5 | 534.7 | 527.2 | 530.1 | 495.0 | 496.0 | 508.9 | 499.3 | 486.7 | 476.3 | 483.0 |
| 2005 | 431.3 | 465.4 | 454.9 | 435.9 | 454.5 | 476.1 | 461.6 | 443.3 | 402.9 | 376.3 | 386.7 | 395.8 |
| 2006 | 363.2 | W | W | W | W | 359.8 | W | 369.2 | W | W | 344.9 | W |
| 2007 | 327.1 | 350.3 | 357.5 | 342.7 | 357.0 | 335.2 | 332.1 | 332.9 | 326.3 | 324.0 | 313.0 | 300.9 |
| 2008 | 281.7 | 275.7 | 268.9 | 275.0 | 268.0 | 257.7 | 244.4 | 241.5 | 218.1 | 232.1 | 220.9 | 224.2 |
| 2009 | 217.1 | 231.5 | 227.0 | 243.0 | 250.5 | 254.8 | 238.4 | 223.6 | 219.2 | 196.4 | 193.6 | 196.1 |
| 2010 | 171.5 | 165.5 | 186.9 | 191.3 | 200.9 | 208.1 | 215.4 | 205.5 | 191.7 | 181.1 | 173.4 | 164.1 |
| 2011 | 148.9 | 157.1 | 150.4 | 145.1 | 154.0 | 166.8 | 164.2 | 161.7 | 145.3 | 148.9 | 149.1 | 144.2 |
| 2012 | 123.6 | 123.5 | 135.8 | 125.3 | 132.0 | 139.2 | 146.7 | 141.7 | 129.7 | 131.5 | 118.8 | 122.1 |
| 2013 | 111.6 | 112.1 | 109.9 | 115.4 | 131.9 | 133.3 | 133.6 | 129.9 | 120.3 | 112.6 | 111.0 | 96.7 |
| 2014 | 88.2 | 97.5 | 94.8 | 104.2 | 113.2 | 111.4 | 113.9 | 116.6 | 102.0 | 99.7 | 92.8 | 89.3 |
| 2015 | 83.6 | 88.1 | 87.7 | 96.7 | 115.8 | 114.7 | 125.7 | 124.1 | 110.4 | 99.2 | 97.3 | 86.3 |
| 2016 | 82.3 | 81.2 | 85.3 | 89.5 | 88.6 | 97.2 | 99.2 | 95.1 | 90.7 | 80.2 | 86.4 | 77.5 |
| 2017 | 69.1 | 74.0 | 71.5 | 82.8 | 83.9 | 107.2 | 93.0 | 97.2 | 81.5 | 60.1 | 50.9 | 52.4 |
| 2018 | 40.5 | 41.6 | 41.7 | 48.0 | 59.6 | 60.8 | 63.2 | 62.7 | 66.0 | 63.5 | 55.6 | 54.6 |
| 2019 | 25.0 | 25.9 | 26.7 | 33.3 | 48.2 | 49.6 | 63.0 | 65.6 | 52.5 | 47.5 | 40.5 | 38.2 |
| 2020 | 32.4 | 36.5 | 30.2 | 20.5 | 36.3 | 58.3 | 61.3 | 50.8 | 48.4 | 36.3 | 32.1 | 25.0 |
| 2021 | 21.9 | 22.0 | 26.2 | 28.9 | 44.8 | 49.7 | 54.2 | 48.3 | 48.1 | 35.0 | 28.1 | 24.4 |
| 2022 | 17.9 | 22.8 | 24.3 | |||||||||
| - = No Data Reported; -- = Not Applicable; NA = Not Available; W = Withheld to avoid disclosure of individual company data. |
| Release Date: 5/19/2022 |
| Next Release Date: TBD |