|
Download Data (XLS File) |
|
||||||||
|
||||||||
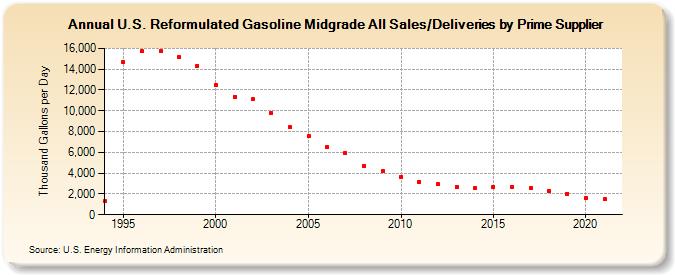
| U.S. Reformulated Gasoline Midgrade All Sales/Deliveries by Prime Supplier (Thousand Gallons per Day) | ||||||||
| Decade | Year-0 | Year-1 | Year-2 | Year-3 | Year-4 | Year-5 | Year-6 | Year-7 | Year-8 | Year-9 |
|---|---|---|---|---|---|---|---|---|---|---|
| 1990's | 1,277.3 | 14,664.2 | 15,723.3 | 15,741.8 | 15,160.5 | 14,336.0 | ||||
| 2000's | 12,490.2 | 11,357.2 | 11,103.6 | 9,799.7 | 8,408.0 | 7,544.6 | 6,473.5 | 5,913.4 | 4,670.2 | 4,168.7 |
| 2010's | 3,662.1 | 3,186.4 | 2,950.5 | 2,665.9 | 2,542.6 | 2,653.4 | 2,704.0 | 2,552.7 | 2,296.3 | 2,018.7 |
| 2020's | 1,650.0 |
| - = No Data Reported; -- = Not Applicable; NA = Not Available; W = Withheld to avoid disclosure of individual company data. |
| Release Date: 6/1/2022 |
| Next Release Date: TBD |