|
Download Data (XLS File) |
|
||||||||
|
||||||||
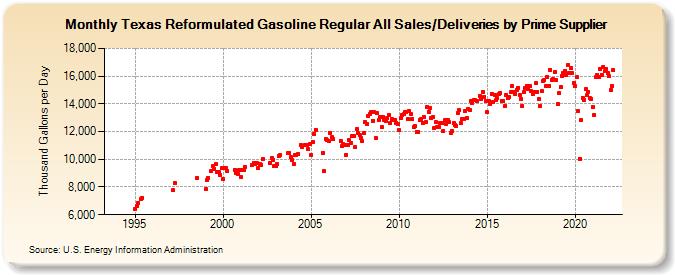
| Texas Reformulated Gasoline Regular All Sales/Deliveries by Prime Supplier (Thousand Gallons per Day) | ||||||||
| Year | Jan | Feb | Mar | Apr | May | Jun | Jul | Aug | Sep | Oct | Nov | Dec |
|---|---|---|---|---|---|---|---|---|---|---|---|---|
| 1993 | - | - | - | |||||||||
| 1994 | - | - | - | - | - | - | - | - | - | - | W | W |
| 1995 | 6,408.0 | 6,619.1 | 6,854.8 | W | 7,122.4 | 7,225.2 | W | W | W | W | W | W |
| 1996 | W | W | W | W | W | W | W | W | W | W | W | W |
| 1997 | W | W | 7,753.1 | 8,317.6 | W | W | W | W | W | W | W | W |
| 1998 | W | W | W | W | W | W | 8,649.3 | W | W | W | W | W |
| 1999 | 7,836.4 | 8,468.9 | 8,651.7 | W | 9,160.2 | 9,487.0 | 9,302.3 | 9,675.4 | 9,051.8 | 9,112.6 | 8,860.1 | 9,370.0 |
| 2000 | 8,551.4 | 9,352.6 | 9,345.3 | 9,147.6 | W | W | W | W | 9,234.6 | 8,986.0 | 8,967.5 | 9,232.2 |
| 2001 | 8,736.5 | 9,221.9 | 9,193.3 | 9,429.5 | W | W | W | W | 9,615.4 | 9,752.9 | 9,636.2 | 9,699.1 |
| 2002 | 9,405.3 | 9,644.3 | 9,561.1 | 10,029.0 | W | W | W | W | 9,756.5 | 10,096.9 | 9,980.6 | 9,499.7 |
| 2003 | 9,499.3 | 9,675.4 | 10,264.1 | 10,322.4 | W | W | W | W | 10,418.0 | 10,453.4 | 10,157.9 | 9,961.4 |
| 2004 | 9,669.9 | 10,337.2 | 10,319.3 | 10,393.7 | W | 11,043.1 | 10,865.6 | W | 10,995.4 | 11,024.9 | 10,729.0 | 11,100.7 |
| 2005 | 10,323.2 | 11,243.3 | 11,819.2 | 12,146.8 | W | W | W | W | 10,488.0 | 9,147.8 | 11,447.9 | 11,362.7 |
| 2006 | 11,308.4 | 11,901.1 | 11,582.2 | 11,459.4 | W | W | W | W | 11,334.1 | 10,923.9 | 11,081.8 | 11,046.3 |
| 2007 | 10,338.3 | 11,055.5 | 11,386.2 | 11,164.3 | 11,656.3 | 11,648.7 | 10,876.8 | 12,169.9 | 11,870.5 | 11,719.7 | 11,549.8 | 11,335.4 |
| 2008 | 11,903.4 | 12,655.2 | 12,552.2 | 13,106.1 | 13,282.4 | 13,435.4 | 12,789.2 | 13,396.7 | 11,538.2 | 13,326.5 | 12,855.2 | 13,042.3 |
| 2009 | 12,314.8 | 13,059.6 | 12,830.4 | 12,786.1 | 12,951.3 | 13,183.6 | 12,590.5 | 12,873.9 | 12,856.1 | 12,843.8 | 12,646.7 | 12,563.1 |
| 2010 | 12,093.9 | 12,994.1 | 13,215.7 | 13,231.6 | 13,398.0 | 13,415.7 | 12,880.9 | 13,467.3 | 13,241.4 | 12,893.2 | 12,313.0 | 12,381.2 |
| 2011 | 11,993.7 | 11,956.8 | 12,835.4 | 12,935.9 | 12,606.6 | 13,074.4 | 12,682.5 | 13,788.9 | 13,413.5 | 13,715.0 | 12,960.9 | 13,035.5 |
| 2012 | 12,289.6 | 12,660.6 | 12,306.2 | 12,309.4 | 12,589.3 | 12,587.0 | 12,037.4 | 12,815.3 | 12,559.1 | 12,843.9 | 12,685.1 | 11,924.1 |
| 2013 | 12,038.0 | 12,597.8 | 12,502.1 | 12,385.6 | 13,340.7 | 13,548.0 | 12,624.7 | 12,871.1 | 12,893.3 | 13,500.3 | 12,982.4 | 13,640.2 |
| 2014 | 13,535.8 | 14,213.0 | 14,067.8 | 14,306.7 | 14,240.7 | 14,196.5 | W | 14,558.1 | 14,346.5 | 14,883.3 | 14,524.7 | 14,220.5 |
| 2015 | 13,392.4 | 14,204.6 | 14,021.8 | 14,727.4 | 14,130.6 | 14,635.3 | 14,242.5 | 14,392.9 | 14,693.8 | 14,791.3 | 14,230.9 | 14,207.4 |
| 2016 | 13,838.4 | 14,622.8 | 14,429.9 | 14,487.6 | 14,831.7 | 15,273.6 | 14,872.7 | 14,745.3 | 15,032.9 | 15,167.1 | 14,652.5 | 14,378.2 |
| 2017 | 13,844.6 | 14,824.0 | 15,144.4 | 15,310.8 | 15,045.3 | 15,264.1 | 14,912.7 | 14,743.3 | 14,853.4 | 15,471.0 | 14,871.1 | 14,346.8 |
| 2018 | 13,861.2 | 14,892.5 | 15,672.7 | 15,750.4 | 15,287.0 | 15,954.2 | 15,321.9 | 16,470.0 | 15,725.8 | 15,790.6 | 16,301.6 | 15,745.4 |
| 2019 | 13,985.0 | 14,766.0 | 15,197.1 | 16,019.9 | 16,212.8 | 16,394.4 | 16,052.1 | 16,833.7 | 16,211.1 | 16,610.1 | 16,208.6 | 15,487.5 |
| 2020 | 15,270.7 | 15,900.3 | 13,480.1 | 10,042.1 | 12,821.5 | 14,439.3 | 14,268.5 | 15,038.4 | 14,617.4 | 14,853.5 | 14,385.4 | 14,352.5 |
| 2021 | 13,805.2 | 13,205.3 | 15,906.7 | 16,085.1 | 15,912.3 | 16,540.7 | 16,104.6 | 16,663.0 | 16,340.0 | 16,529.3 | 16,256.8 | 15,976.2 |
| 2022 | 14,985.5 | 15,288.7 | 16,423.2 | |||||||||
| - = No Data Reported; -- = Not Applicable; NA = Not Available; W = Withheld to avoid disclosure of individual company data. |
| Release Date: 5/19/2022 |
| Next Release Date: TBD |