|
Download Data (XLS File) |
|
||||||||
|
||||||||
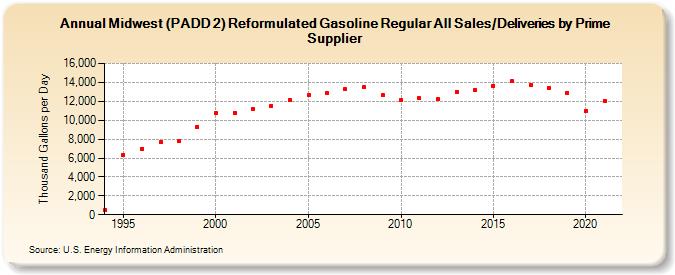
| Midwest (PADD 2) Reformulated Gasoline Regular All Sales/Deliveries by Prime Supplier (Thousand Gallons per Day) | ||||||||
| Decade | Year-0 | Year-1 | Year-2 | Year-3 | Year-4 | Year-5 | Year-6 | Year-7 | Year-8 | Year-9 |
|---|---|---|---|---|---|---|---|---|---|---|
| 1990's | 497.2 | 6,342.6 | 6,989.3 | 7,670.9 | 7,795.7 | 9,318.5 | ||||
| 2000's | 10,709.1 | 10,808.9 | 11,197.3 | 11,549.8 | 12,155.7 | 12,636.8 | 12,849.9 | 13,260.7 | 13,472.8 | 12,631.7 |
| 2010's | 12,154.6 | 12,313.6 | 12,222.4 | 13,009.7 | 13,207.5 | 13,668.8 | 14,112.4 | 13,684.8 | 13,456.0 | 12,928.3 |
| 2020's | 11,023.3 |
| - = No Data Reported; -- = Not Applicable; NA = Not Available; W = Withheld to avoid disclosure of individual company data. |
| Release Date: 6/1/2022 |
| Next Release Date: TBD |