|
Download Data (XLS File) |
|
||||||||
|
||||||||
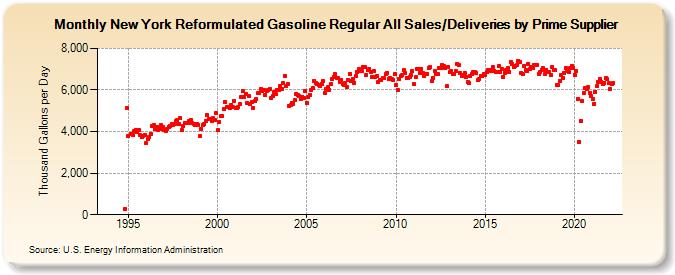
| New York Reformulated Gasoline Regular All Sales/Deliveries by Prime Supplier (Thousand Gallons per Day) | ||||||||
| Year | Jan | Feb | Mar | Apr | May | Jun | Jul | Aug | Sep | Oct | Nov | Dec |
|---|---|---|---|---|---|---|---|---|---|---|---|---|
| 1993 | - | - | - | |||||||||
| 1994 | - | - | - | - | - | - | - | - | - | - | 251.5 | 5,145.4 |
| 1995 | 3,784.8 | W | 3,893.2 | 3,829.6 | 4,031.9 | 4,097.6 | 3,980.5 | 4,054.7 | 3,830.1 | 3,743.1 | 3,791.4 | 3,826.1 |
| 1996 | 3,433.0 | 3,639.4 | 3,759.6 | 3,900.0 | 4,268.4 | 4,311.6 | 4,127.5 | 4,237.2 | 4,092.3 | 4,106.2 | 4,308.8 | 4,227.2 |
| 1997 | 4,057.2 | 4,025.0 | 4,128.9 | 4,228.9 | 4,264.5 | 4,373.8 | 4,339.2 | 4,351.7 | 4,488.2 | 4,536.7 | 4,384.9 | 4,639.5 |
| 1998 | 4,088.3 | 4,250.3 | 4,423.0 | 4,406.1 | 4,435.2 | 4,483.6 | 4,544.5 | 4,429.9 | 4,376.6 | 4,330.7 | 4,341.6 | 4,331.5 |
| 1999 | 3,809.1 | 4,112.0 | 4,318.6 | 4,345.9 | 4,506.6 | 4,778.4 | 4,602.2 | 4,619.4 | 4,505.0 | 4,633.3 | 4,573.3 | 4,872.9 |
| 2000 | 4,074.5 | 4,459.4 | 4,724.2 | 4,740.6 | 5,072.1 | 5,433.0 | 5,159.5 | 5,204.1 | 5,121.7 | 5,282.8 | 5,201.1 | 5,448.0 |
| 2001 | 5,136.3 | 5,122.0 | 5,203.2 | 5,306.0 | 5,661.5 | 5,929.0 | 5,679.3 | 5,796.0 | 5,390.2 | 5,694.9 | 5,333.0 | 5,415.8 |
| 2002 | 5,149.1 | 5,459.7 | 5,547.8 | 5,840.0 | 5,866.9 | 6,065.6 | 5,941.5 | 6,021.2 | 5,778.9 | 5,974.3 | 5,983.7 | 6,053.7 |
| 2003 | 5,624.0 | 5,692.3 | 5,912.8 | 5,822.5 | 5,982.6 | 6,015.9 | 6,178.8 | 6,054.8 | 6,316.2 | 6,681.8 | 6,185.2 | 6,300.4 |
| 2004 | 5,250.1 | 5,261.1 | 5,395.0 | 5,339.6 | 5,527.9 | 5,822.6 | 5,754.2 | 5,689.9 | 5,589.3 | 5,675.1 | 5,634.6 | 5,928.6 |
| 2005 | 5,393.8 | 5,681.0 | 5,777.6 | 6,014.7 | 6,091.0 | 6,444.6 | 6,337.9 | 6,307.7 | 6,242.7 | 6,212.4 | 6,302.8 | 6,440.3 |
| 2006 | 5,844.6 | 6,042.8 | 6,125.1 | 6,014.1 | 6,285.3 | 6,531.8 | 6,620.5 | 6,755.1 | 6,599.8 | 6,566.7 | 6,406.7 | 6,495.3 |
| 2007 | 6,270.8 | 6,247.9 | 6,354.0 | 6,119.9 | 6,485.2 | 6,784.7 | 6,443.3 | 6,531.6 | 6,353.4 | 6,649.9 | 6,882.0 | 7,014.8 |
| 2008 | 6,929.1 | 6,911.8 | 7,102.9 | 7,095.4 | 6,724.6 | 6,953.3 | 7,003.8 | 6,848.0 | 6,638.1 | 6,898.7 | 6,607.6 | 6,682.5 |
| 2009 | 6,393.7 | 6,495.6 | 6,496.8 | 6,560.8 | 6,574.8 | 6,768.1 | 6,839.6 | 6,528.3 | 6,564.1 | 6,520.6 | 6,477.7 | 6,759.7 |
| 2010 | 6,243.0 | 6,018.3 | 6,528.0 | 6,651.6 | 6,706.3 | 6,971.4 | 6,821.1 | 6,596.3 | 6,567.3 | 6,617.0 | 6,723.6 | 6,904.0 |
| 2011 | 6,285.0 | 6,609.2 | 7,019.1 | 7,015.6 | 6,831.1 | 7,032.0 | 6,794.1 | 6,671.1 | 6,769.4 | 6,781.9 | 7,053.7 | 7,103.8 |
| 2012 | 6,437.4 | 6,590.2 | 6,897.1 | 6,750.4 | 6,781.3 | 7,071.6 | 7,063.3 | 7,207.4 | 7,150.0 | 7,052.5 | 6,178.8 | 7,083.1 |
| 2013 | 6,876.3 | 6,917.6 | 6,748.2 | 6,766.4 | 6,904.7 | 7,269.4 | 7,190.4 | 6,834.6 | 6,660.9 | 6,708.8 | 6,837.0 | 6,624.0 |
| 2014 | 6,376.4 | 6,317.6 | 6,693.3 | 6,754.0 | 6,850.1 | 6,844.4 | 6,815.6 | 6,473.3 | 6,522.7 | 6,680.4 | 6,649.7 | 6,762.6 |
| 2015 | 6,742.3 | 6,847.5 | 6,976.8 | 6,959.5 | 6,928.2 | 7,102.6 | 6,930.8 | 6,882.5 | 6,884.0 | 7,141.5 | 6,862.8 | 6,993.0 |
| 2016 | 6,633.8 | 6,835.9 | 6,971.3 | 7,033.7 | 6,864.6 | 7,363.4 | 7,240.8 | 7,104.3 | 7,152.2 | 7,186.5 | 7,400.2 | 7,349.6 |
| 2017 | 6,828.5 | 6,766.8 | 7,173.3 | 6,966.9 | 6,911.3 | 7,272.4 | 7,013.9 | 7,093.1 | 7,042.2 | 7,201.8 | 7,201.3 | 7,212.6 |
| 2018 | 6,770.5 | 6,869.4 | 6,965.6 | 7,033.7 | 6,749.2 | 6,967.3 | 6,856.0 | 6,869.0 | 6,712.3 | 7,087.1 | 6,983.4 | 6,947.5 |
| 2019 | 6,248.4 | 6,233.7 | 6,455.5 | 6,724.8 | 6,590.6 | 6,803.6 | 7,054.8 | 6,906.2 | 6,887.1 | 7,045.5 | 7,156.6 | 7,068.0 |
| 2020 | 6,736.0 | 6,891.9 | 5,568.1 | 3,493.3 | 4,519.5 | 5,478.7 | 5,847.8 | 6,102.3 | 6,059.1 | 6,127.4 | 5,868.9 | 5,700.7 |
| 2021 | 5,554.0 | 5,338.4 | 5,924.7 | 6,179.4 | 6,388.4 | 6,506.4 | 6,384.5 | 6,281.4 | 6,352.2 | 6,572.1 | 6,518.3 | 6,318.5 |
| 2022 | 6,055.7 | 6,270.1 | 6,338.3 | |||||||||
| - = No Data Reported; -- = Not Applicable; NA = Not Available; W = Withheld to avoid disclosure of individual company data. |
| Release Date: 5/19/2022 |
| Next Release Date: TBD |