|
Download Data (XLS File) |
|
||||||||
|
||||||||
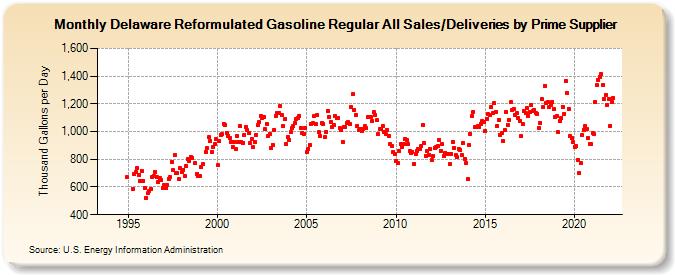
| Delaware Reformulated Gasoline Regular All Sales/Deliveries by Prime Supplier (Thousand Gallons per Day) | ||||||||
| Year | Jan | Feb | Mar | Apr | May | Jun | Jul | Aug | Sep | Oct | Nov | Dec |
|---|---|---|---|---|---|---|---|---|---|---|---|---|
| 1993 | - | - | - | |||||||||
| 1994 | - | - | - | - | - | - | - | - | - | - | W | 669.8 |
| 1995 | W | W | W | 589.0 | 690.5 | 709.4 | 735.4 | 686.7 | 639.7 | 715.5 | 645.7 | 589.2 |
| 1996 | 523.3 | 553.8 | 568.1 | 586.8 | 675.5 | 682.7 | 707.2 | 671.9 | 634.0 | 661.8 | 652.2 | 594.7 |
| 1997 | 612.3 | 589.9 | 611.6 | 658.3 | 672.1 | 781.7 | 720.2 | 829.4 | 697.5 | 700.4 | 654.9 | 734.1 |
| 1998 | 707.1 | 725.0 | 679.3 | 751.1 | 798.6 | 786.7 | 819.0 | 812.5 | W | 770.5 | 695.3 | 680.2 |
| 1999 | 675.9 | 746.6 | 765.6 | W | 855.9 | 879.6 | 957.9 | 934.3 | 855.6 | 892.1 | 908.2 | 946.7 |
| 2000 | 755.7 | 930.1 | 976.4 | 978.9 | 1,054.9 | 1,046.5 | 988.1 | 969.1 | 956.0 | 924.9 | 888.9 | 927.8 |
| 2001 | 872.5 | 970.7 | 928.0 | 1,039.7 | 925.0 | 917.9 | 976.4 | 1,033.4 | 1,010.7 | 988.9 | 915.0 | 947.8 |
| 2002 | 885.2 | 923.7 | 976.2 | 1,043.8 | 1,067.0 | 1,113.6 | 1,096.9 | 1,104.2 | 1,017.5 | 1,056.8 | 968.5 | 978.8 |
| 2003 | 881.5 | 905.2 | 1,011.4 | 1,113.0 | 1,133.1 | 1,136.2 | 1,184.0 | 1,117.9 | 1,041.7 | 1,087.5 | 912.8 | 961.5 |
| 2004 | 942.0 | 995.2 | 1,022.7 | 1,043.2 | 1,062.2 | 1,091.3 | 1,096.6 | 1,114.9 | 1,025.5 | 991.8 | 983.2 | 1,027.0 |
| 2005 | 850.4 | 875.5 | 905.5 | 1,055.3 | 1,059.5 | 1,114.7 | 1,055.1 | 1,120.4 | 993.3 | 970.5 | 1,060.8 | 1,056.3 |
| 2006 | 961.9 | 999.3 | 1,149.3 | 1,105.5 | 1,070.0 | 1,031.8 | 1,045.6 | 1,113.9 | 1,096.7 | 1,099.1 | 1,023.7 | 1,010.3 |
| 2007 | 926.4 | 1,035.9 | 1,034.6 | 1,062.5 | 1,066.5 | 1,057.5 | 1,175.4 | 1,270.3 | 1,156.2 | 1,121.1 | 1,043.4 | 1,008.6 |
| 2008 | 1,016.6 | 1,006.4 | 1,019.0 | 1,037.6 | 1,023.7 | 1,102.6 | 1,102.0 | 1,103.5 | 1,076.5 | 1,138.8 | 1,117.8 | 1,080.4 |
| 2009 | 982.1 | 1,016.9 | 1,014.9 | 1,042.3 | 997.9 | 978.8 | 1,014.7 | 968.0 | 907.5 | 895.5 | 854.0 | 835.3 |
| 2010 | 790.8 | 772.5 | 861.1 | 910.4 | 886.9 | 907.9 | 948.3 | 942.5 | 907.7 | 859.5 | 843.2 | 854.7 |
| 2011 | 768.7 | 836.8 | 861.5 | 871.6 | 872.4 | 892.6 | 1,044.4 | 915.9 | 826.5 | 859.5 | 830.8 | 872.7 |
| 2012 | 792.9 | 824.1 | 882.4 | 889.0 | 894.3 | 938.1 | 862.2 | 909.8 | 822.3 | 847.1 | W | 839.5 |
| 2013 | 765.2 | 840.6 | 927.7 | 883.4 | 828.1 | 816.0 | 874.7 | 867.0 | 829.0 | 918.7 | 802.4 | 773.5 |
| 2014 | 656.3 | 904.2 | 984.1 | 1,113.2 | 1,142.0 | 1,031.4 | 1,031.1 | 1,039.1 | 1,033.6 | 1,056.8 | 1,077.7 | 1,070.3 |
| 2015 | 1,003.7 | 1,093.8 | 1,126.5 | 1,116.7 | 1,178.0 | 1,136.1 | 1,202.5 | 1,142.9 | 1,039.4 | 1,085.7 | 977.1 | 986.3 |
| 2016 | 931.6 | 1,008.6 | 1,144.6 | 1,047.3 | 1,086.0 | 1,209.8 | 1,155.7 | 1,163.6 | 1,121.8 | 1,132.2 | 1,098.3 | 1,077.6 |
| 2017 | 966.8 | 1,057.8 | 1,145.4 | 1,135.4 | 1,169.6 | 1,114.1 | 1,137.6 | 1,191.8 | 1,151.3 | 1,155.3 | 1,131.4 | 1,128.8 |
| 2018 | 1,026.9 | 1,062.6 | 1,231.5 | 1,174.0 | 1,331.0 | 1,204.9 | 1,212.0 | 1,176.8 | 1,193.7 | 1,215.5 | 1,163.2 | 1,104.3 |
| 2019 | 1,113.4 | 994.6 | 1,072.6 | 1,096.3 | 1,180.2 | 1,130.2 | 1,367.4 | 1,278.9 | 1,164.9 | 967.3 | 952.5 | 922.3 |
| 2020 | 892.1 | 897.2 | 795.1 | 700.3 | 773.4 | 976.0 | 1,014.4 | 1,038.1 | 1,019.9 | 953.2 | 911.7 | 907.7 |
| 2021 | 988.8 | 982.8 | 1,214.8 | 1,333.0 | 1,374.7 | 1,396.0 | 1,414.4 | 1,337.6 | 1,234.0 | 1,267.3 | 1,191.8 | 1,236.4 |
| 2022 | 1,043.4 | 1,214.5 | 1,242.5 | |||||||||
| - = No Data Reported; -- = Not Applicable; NA = Not Available; W = Withheld to avoid disclosure of individual company data. |
| Release Date: 5/19/2022 |
| Next Release Date: TBD |