|
Download Data (XLS File) |
|
||||||||
|
||||||||
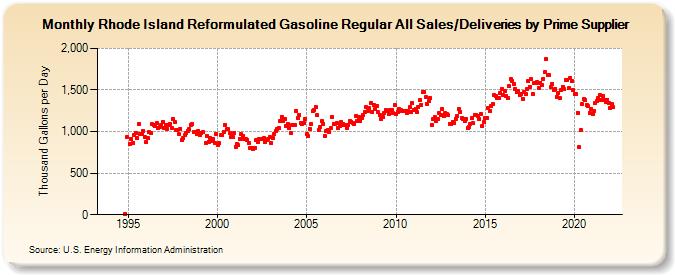
| Rhode Island Reformulated Gasoline Regular All Sales/Deliveries by Prime Supplier (Thousand Gallons per Day) | ||||||||
| Year | Jan | Feb | Mar | Apr | May | Jun | Jul | Aug | Sep | Oct | Nov | Dec |
|---|---|---|---|---|---|---|---|---|---|---|---|---|
| 1993 | - | - | - | |||||||||
| 1994 | - | - | - | - | - | - | - | - | - | - | 11.4 | 933.1 |
| 1995 | W | 852.8 | 909.7 | 861.4 | 961.1 | 981.5 | 922.4 | 1,091.1 | 976.1 | 973.6 | 1,007.5 | 937.4 |
| 1996 | 875.8 | 921.6 | 992.1 | 987.9 | 1,087.4 | 1,082.3 | 1,065.5 | 1,104.9 | 1,047.5 | 1,057.0 | 1,076.2 | 1,116.8 |
| 1997 | 1,039.2 | 1,074.4 | 1,035.0 | 1,072.9 | 1,091.8 | 1,048.1 | 1,150.6 | 1,116.5 | 1,016.6 | 1,013.7 | 968.6 | 1,031.5 |
| 1998 | 898.9 | 928.2 | 953.2 | 986.5 | 1,008.5 | 1,028.2 | 1,083.0 | 1,092.1 | 995.5 | 988.7 | 966.5 | 1,012.1 |
| 1999 | 955.6 | 981.0 | 988.7 | W | 864.9 | 952.3 | 878.1 | 920.3 | 882.6 | 907.3 | 860.6 | 976.2 |
| 2000 | 841.8 | 857.9 | 955.9 | 958.6 | 995.7 | 1,082.1 | 1,030.2 | 1,027.6 | 979.1 | 929.6 | 935.1 | 984.3 |
| 2001 | 819.7 | 847.8 | 834.4 | 914.9 | 965.2 | 949.8 | 915.9 | 908.9 | 895.8 | 859.6 | 807.8 | 804.2 |
| 2002 | 787.9 | 804.0 | 892.5 | 869.0 | 906.8 | 907.3 | 912.3 | 921.1 | 877.3 | 902.4 | 906.2 | 935.2 |
| 2003 | 865.2 | 927.1 | 971.9 | 1,000.7 | 1,033.1 | 1,047.0 | 1,129.6 | 1,179.5 | 1,121.2 | 1,146.9 | 1,069.0 | 1,096.3 |
| 2004 | 1,040.5 | 988.0 | 1,078.0 | 1,076.6 | 1,081.0 | 1,246.7 | 1,165.3 | 1,198.9 | 1,098.3 | 1,090.9 | 1,096.9 | 1,152.9 |
| 2005 | 966.9 | 942.1 | 1,033.6 | 1,085.4 | 1,243.8 | 1,263.4 | 1,297.3 | 1,194.2 | 1,021.6 | 1,053.9 | 1,122.4 | 1,094.1 |
| 2006 | 950.6 | 1,006.1 | 1,017.3 | 997.4 | 1,038.9 | 1,175.5 | 1,091.7 | 1,088.9 | 1,105.1 | 1,045.1 | 1,069.9 | 1,111.0 |
| 2007 | 1,096.6 | 1,074.9 | 1,074.8 | 1,046.9 | 1,083.6 | 1,127.8 | 1,116.5 | 1,105.3 | 1,093.9 | 1,192.6 | 1,132.0 | 1,180.6 |
| 2008 | 1,132.0 | 1,162.2 | 1,196.2 | 1,233.5 | 1,289.7 | 1,251.9 | 1,279.7 | 1,341.7 | 1,239.7 | 1,319.1 | 1,265.3 | 1,308.1 |
| 2009 | 1,229.4 | 1,195.5 | 1,148.5 | 1,172.4 | 1,223.5 | 1,262.0 | 1,246.7 | 1,211.2 | 1,259.2 | 1,256.7 | 1,217.3 | 1,317.2 |
| 2010 | 1,215.2 | 1,232.4 | 1,267.0 | 1,263.6 | 1,249.7 | 1,243.0 | 1,247.2 | 1,219.2 | 1,243.4 | 1,291.4 | 1,239.1 | 1,338.9 |
| 2011 | 1,264.7 | 1,275.4 | 1,229.2 | 1,296.5 | 1,376.2 | 1,319.6 | 1,474.4 | 1,472.7 | 1,416.7 | 1,335.4 | 1,368.8 | 1,402.1 |
| 2012 | 1,083.2 | 1,146.7 | 1,171.2 | 1,128.7 | 1,146.5 | 1,227.3 | 1,202.4 | 1,269.5 | 1,187.1 | 1,223.4 | 1,214.1 | 1,195.6 |
| 2013 | 1,094.4 | 1,092.6 | 1,120.5 | 1,103.1 | 1,155.0 | 1,188.7 | 1,266.5 | 1,233.4 | 1,160.9 | 1,152.5 | 1,127.7 | 1,151.5 |
| 2014 | 1,040.4 | 1,056.5 | 1,091.1 | 1,158.4 | 1,102.1 | 1,202.1 | 1,194.1 | 1,182.2 | 1,148.2 | 1,216.8 | 1,069.4 | 1,112.8 |
| 2015 | 1,168.4 | 1,163.9 | 1,288.6 | 1,252.3 | 1,305.0 | 1,329.7 | 1,437.6 | 1,423.7 | 1,407.4 | 1,408.0 | 1,461.2 | 1,512.1 |
| 2016 | 1,436.9 | 1,484.8 | 1,431.5 | 1,402.7 | 1,547.7 | 1,626.0 | 1,609.1 | 1,576.8 | 1,513.7 | 1,473.2 | 1,488.3 | 1,442.5 |
| 2017 | 1,446.9 | 1,396.8 | 1,470.4 | 1,447.6 | 1,506.7 | 1,604.2 | 1,540.7 | 1,626.8 | 1,457.1 | 1,583.3 | 1,580.7 | 1,595.2 |
| 2018 | 1,528.1 | 1,589.5 | 1,564.8 | 1,635.1 | 1,712.1 | 1,870.0 | 1,677.9 | 1,675.3 | 1,534.2 | 1,572.5 | 1,500.8 | 1,512.2 |
| 2019 | 1,420.9 | 1,457.7 | 1,398.7 | 1,494.6 | 1,541.0 | 1,509.2 | 1,619.5 | 1,618.7 | 1,519.6 | 1,640.0 | 1,609.6 | 1,497.5 |
| 2020 | 1,452.0 | 1,452.5 | 1,227.0 | 813.4 | 1,013.7 | 1,325.7 | 1,386.9 | 1,374.7 | 1,321.5 | 1,302.8 | 1,222.3 | 1,272.0 |
| 2021 | 1,207.8 | 1,245.0 | 1,341.3 | 1,369.3 | 1,407.5 | 1,439.2 | 1,375.4 | 1,428.5 | 1,381.9 | 1,357.2 | 1,383.7 | 1,338.9 |
| 2022 | 1,287.7 | 1,326.8 | 1,292.7 | |||||||||
| - = No Data Reported; -- = Not Applicable; NA = Not Available; W = Withheld to avoid disclosure of individual company data. |
| Release Date: 5/19/2022 |
| Next Release Date: TBD |