|
Download Data (XLS File) |
|
||||||||
|
||||||||
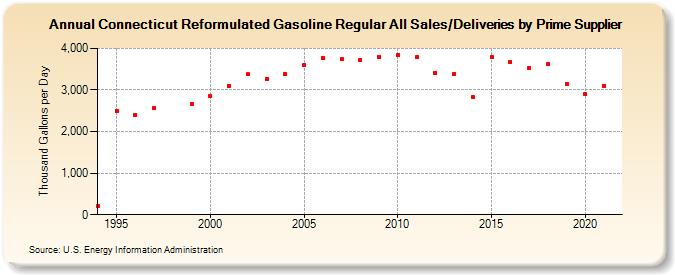
| Connecticut Reformulated Gasoline Regular All Sales/Deliveries by Prime Supplier (Thousand Gallons per Day) | ||||||||
| Decade | Year-0 | Year-1 | Year-2 | Year-3 | Year-4 | Year-5 | Year-6 | Year-7 | Year-8 | Year-9 |
|---|---|---|---|---|---|---|---|---|---|---|
| 1990's | 218.3 | 2,505.5 | 2,396.4 | 2,562.1 | W | 2,670.9 | ||||
| 2000's | 2,845.1 | 3,100.9 | 3,376.7 | 3,273.0 | 3,385.1 | 3,602.1 | 3,769.2 | 3,743.5 | 3,715.3 | 3,795.1 |
| 2010's | 3,845.6 | 3,784.6 | 3,418.2 | 3,393.2 | 2,829.0 | 3,781.1 | 3,677.6 | 3,528.3 | 3,614.5 | 3,144.1 |
| 2020's | 2,898.3 |
| - = No Data Reported; -- = Not Applicable; NA = Not Available; W = Withheld to avoid disclosure of individual company data. |
| Release Date: 6/1/2022 |
| Next Release Date: TBD |