|
Download Data (XLS File) |
|
||||||||
|
||||||||
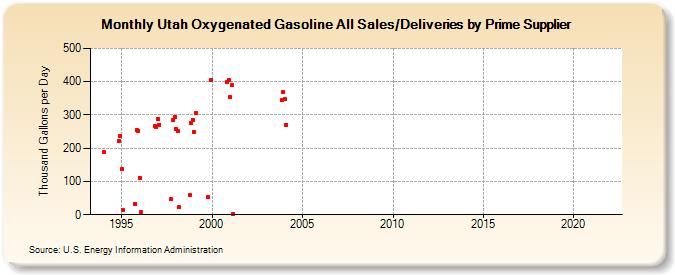
| Utah Oxygenated Gasoline All Sales/Deliveries by Prime Supplier (Thousand Gallons per Day) | ||||||||
| Year | Jan | Feb | Mar | Apr | May | Jun | Jul | Aug | Sep | Oct | Nov | Dec |
|---|---|---|---|---|---|---|---|---|---|---|---|---|
| 1993 | NA | NA | NA | |||||||||
| 1994 | 187.4 | W | W | W | - | - | - | - | W | W | 222.8 | 235.8 |
| 1995 | 136.5 | 12.8 | W | - | - | - | - | - | - | 32.8 | 256.1 | 252.4 |
| 1996 | 111.0 | 7.3 | - | - | - | - | - | - | W | W | 268.0 | 264.9 |
| 1997 | 288.7 | 271.2 | W | - | - | - | - | - | W | 46.6 | 284.6 | 294.6 |
| 1998 | 258.3 | 251.9 | 22.0 | W | - | - | - | - | W | 59.8 | 274.4 | 286.0 |
| 1999 | 249.8 | 307.1 | W | - | - | - | - | - | - | 53.4 | W | 404.6 |
| 2000 | W | W | W | W | - | - | - | - | W | W | 398.4 | 405.5 |
| 2001 | 352.8 | 391.4 | 2.2 | W | - | - | - | - | - | W | W | W |
| 2002 | W | W | W | - | - | - | - | - | - | W | W | W |
| 2003 | W | W | - | - | - | - | - | - | - | W | 344.1 | 367.7 |
| 2004 | 347.3 | 270.8 | - | - | - | - | - | - | - | - | - | - |
| 2005 | - | - | - | - | - | - | - | - | - | - | - | - |
| 2006 | - | - | - | - | - | - | - | - | - | - | - | - |
| 2007 | - | - | - | - | - | - | - | - | - | - | - | - |
| 2008 | - | - | - | - | - | - | - | - | - | - | - | - |
| 2009 | - | - | - | - | - | - | - | - | - | - | - | - |
| 2010 | - | - | - | - | - | - | - | - | - | - | - | - |
| 2011 | - | - | - | - | - | - | - | - | - | - | - | - |
| 2012 | - | - | - | - | - | - | - | - | - | - | - | - |
| 2013 | - | - | - | - | - | - | - | - | - | - | - | - |
| 2014 | - | - | - | - | - | - | - | - | - | - | - | - |
| 2015 | - | - | - | - | - | - | - | - | - | - | - | - |
| 2016 | - | - | - | - | - | - | - | - | - | - | - | - |
| 2017 | - | - | - | - | - | - | - | - | - | - | - | - |
| 2018 | - | - | - | - | - | - | - | - | - | - | - | - |
| 2019 | - | - | - | - | - | - | - | - | - | - | - | - |
| 2020 | - | - | - | - | - | - | - | - | - | - | - | - |
| 2021 | - | - | - | - | - | - | - | - | - | - | - | - |
| 2022 | - | - | - | |||||||||
| - = No Data Reported; -- = Not Applicable; NA = Not Available; W = Withheld to avoid disclosure of individual company data. |
| Release Date: 5/19/2022 |
| Next Release Date: TBD |