|
Download Data (XLS File) |
|
||||||||
|
||||||||
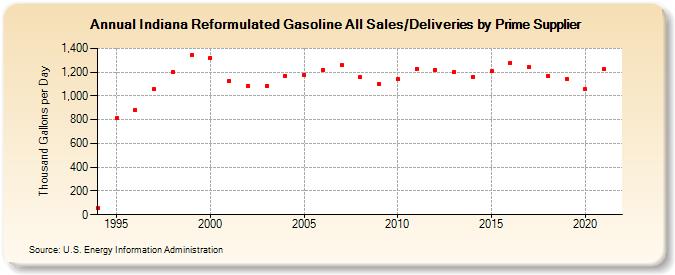
| Indiana Reformulated Gasoline All Sales/Deliveries by Prime Supplier (Thousand Gallons per Day) | ||||||||
| Decade | Year-0 | Year-1 | Year-2 | Year-3 | Year-4 | Year-5 | Year-6 | Year-7 | Year-8 | Year-9 |
|---|---|---|---|---|---|---|---|---|---|---|
| 1990's | 56.6 | 809.9 | 883.3 | 1,055.8 | 1,199.0 | 1,343.2 | ||||
| 2000's | 1,320.1 | 1,127.6 | 1,083.5 | 1,084.8 | 1,170.7 | 1,174.6 | 1,217.1 | 1,259.8 | 1,157.8 | 1,102.2 |
| 2010's | 1,140.0 | 1,228.9 | 1,217.5 | 1,201.5 | 1,162.9 | 1,206.3 | 1,281.2 | 1,241.7 | 1,166.5 | 1,145.5 |
| 2020's | 1,056.0 |
| - = No Data Reported; -- = Not Applicable; NA = Not Available; W = Withheld to avoid disclosure of individual company data. |
| Release Date: 6/1/2022 |
| Next Release Date: TBD |