|
Download Data (XLS File) |
|
||||||||
|
||||||||
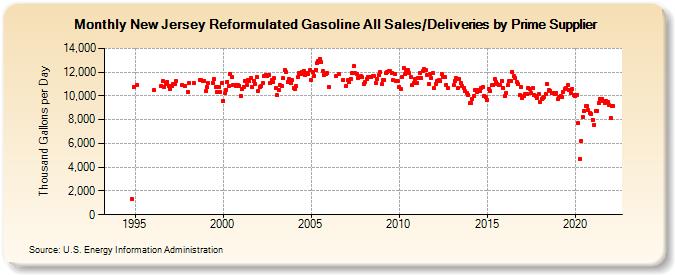
| New Jersey Reformulated Gasoline All Sales/Deliveries by Prime Supplier (Thousand Gallons per Day) | ||||||||
| Year | Jan | Feb | Mar | Apr | May | Jun | Jul | Aug | Sep | Oct | Nov | Dec |
|---|---|---|---|---|---|---|---|---|---|---|---|---|
| 1993 | - | - | - | |||||||||
| 1994 | - | - | - | - | - | - | - | - | - | - | 1,298.9 | 10,758.5 |
| 1995 | W | 10,883.6 | W | W | W | W | W | W | W | W | W | W |
| 1996 | W | 10,478.7 | W | W | W | W | 10,861.7 | 11,236.5 | 10,743.9 | 11,016.7 | 11,183.3 | 10,843.4 |
| 1997 | 10,592.4 | 10,825.6 | 10,964.5 | 11,020.9 | 11,273.5 | W | W | W | 10,903.9 | W | 10,843.1 | W |
| 1998 | 10,324.7 | 11,089.5 | W | W | 11,097.7 | W | W | W | 11,372.8 | 11,330.5 | 11,285.0 | 11,261.4 |
| 1999 | 10,412.9 | 10,709.4 | 11,072.5 | W | W | 11,117.4 | 11,385.1 | 10,713.8 | 10,361.9 | 10,768.6 | 10,360.5 | 11,076.6 |
| 2000 | 9,595.9 | 10,205.7 | 10,529.1 | 11,211.2 | 10,852.7 | 11,863.2 | 11,551.4 | 10,944.0 | 10,933.3 | 10,796.5 | 10,882.2 | 10,873.9 |
| 2001 | 9,999.2 | 10,540.3 | 10,774.4 | 11,284.5 | 10,927.5 | 11,379.9 | 11,260.6 | 11,489.6 | 10,738.0 | 11,276.6 | 11,008.7 | 11,572.5 |
| 2002 | 10,440.6 | 10,716.4 | 10,807.6 | 11,104.7 | 11,643.8 | 11,779.2 | 11,646.5 | 11,736.0 | 11,115.6 | 11,369.4 | 11,135.2 | 11,468.2 |
| 2003 | 10,702.4 | 10,038.3 | 10,509.9 | 10,881.2 | 10,860.8 | 11,475.2 | 12,170.0 | 12,003.1 | 11,197.2 | 11,419.3 | 11,097.7 | 11,305.4 |
| 2004 | 10,637.4 | 10,549.9 | 10,809.9 | 11,567.8 | 11,940.9 | 11,844.8 | 12,032.8 | 12,129.7 | 11,765.7 | 11,942.6 | 11,815.1 | 12,159.7 |
| 2005 | 11,367.7 | 12,011.6 | 11,678.6 | 12,203.9 | 12,729.6 | 12,903.4 | 13,113.4 | 12,830.2 | 12,095.1 | 11,794.1 | 11,859.1 | 11,897.5 |
| 2006 | 10,789.1 | W | W | W | W | 11,636.5 | W | 11,816.5 | W | W | 11,341.8 | W |
| 2007 | 10,843.9 | 11,330.3 | 11,133.5 | 11,446.6 | 11,927.3 | 12,518.7 | 11,908.1 | 11,860.0 | 11,511.2 | 11,630.9 | 11,640.9 | 11,560.9 |
| 2008 | 11,035.7 | 11,186.2 | 11,426.2 | 11,611.8 | 11,566.1 | 11,610.0 | 11,645.3 | 11,661.0 | 11,077.6 | 11,434.9 | 11,728.0 | 11,973.2 |
| 2009 | 10,974.4 | 11,370.3 | 11,368.7 | 11,926.4 | 11,986.0 | 12,063.3 | 12,057.0 | 11,937.2 | 11,355.2 | 11,845.4 | 11,243.1 | 11,230.6 |
| 2010 | 10,779.3 | 10,594.2 | 11,578.4 | 12,338.8 | 11,868.6 | 12,211.4 | 12,193.4 | 11,919.5 | 11,607.3 | 10,890.5 | 11,123.6 | 11,391.2 |
| 2011 | 11,125.1 | 11,534.0 | 11,946.8 | 11,526.1 | 12,074.0 | 12,230.1 | 12,158.7 | 11,782.3 | 11,036.8 | 11,813.3 | 11,523.2 | 11,965.6 |
| 2012 | 10,642.4 | 10,967.6 | 11,249.2 | 11,334.5 | 11,241.6 | 11,868.5 | 11,617.0 | 11,628.2 | 10,948.8 | 10,665.1 | W | W |
| 2013 | W | 10,918.2 | 11,252.5 | 11,482.4 | 10,635.2 | 11,411.0 | 11,118.3 | 10,820.5 | 10,624.0 | 10,410.8 | 10,268.7 | 10,088.3 |
| 2014 | 9,375.0 | 9,436.8 | 9,778.6 | 9,955.7 | 10,473.8 | 10,308.3 | 10,497.5 | 10,387.1 | 10,690.7 | 10,784.6 | 10,030.8 | 9,931.1 |
| 2015 | 9,637.7 | 10,620.0 | 10,411.7 | 10,883.6 | 10,958.8 | 11,402.1 | 11,148.0 | 11,005.7 | 10,928.4 | 10,915.8 | 11,287.4 | 10,657.0 |
| 2016 | 9,959.7 | 10,213.1 | 10,886.1 | 11,216.9 | 11,281.6 | 12,027.9 | 11,635.9 | 11,520.2 | 11,172.9 | 11,013.6 | 10,052.6 | 10,718.4 |
| 2017 | 9,847.1 | 9,986.1 | 10,126.7 | 10,123.1 | 10,670.4 | 10,600.2 | 10,250.5 | 10,647.9 | 10,070.1 | 10,016.8 | 9,854.7 | 10,142.4 |
| 2018 | 9,481.5 | 9,756.5 | 9,852.2 | 9,943.8 | 10,172.8 | 11,026.6 | 10,493.0 | 10,453.1 | 10,229.5 | 10,227.6 | 10,182.6 | 10,224.9 |
| 2019 | 9,720.3 | 9,926.4 | 9,993.6 | 9,869.8 | 10,334.6 | 10,581.6 | 10,635.9 | 10,892.8 | 10,491.4 | 10,241.7 | 10,609.7 | 10,081.3 |
| 2020 | 9,991.3 | 10,102.6 | 7,706.8 | 4,690.6 | 6,212.6 | 8,232.7 | 8,750.3 | 9,109.3 | 9,125.3 | 8,788.8 | 8,587.5 | 8,462.5 |
| 2021 | 7,995.6 | 7,577.5 | 8,710.2 | 8,754.7 | 9,413.3 | 9,757.7 | 9,712.5 | 9,606.2 | 9,435.8 | 9,564.5 | 9,480.1 | 9,201.2 |
| 2022 | 8,133.5 | 9,149.6 | 9,151.7 | |||||||||
| - = No Data Reported; -- = Not Applicable; NA = Not Available; W = Withheld to avoid disclosure of individual company data. |
| Release Date: 5/19/2022 |
| Next Release Date: TBD |