|
Download Data (XLS File) |
|
||||||||
|
||||||||
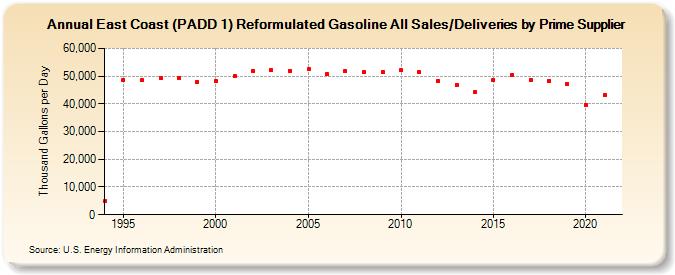
| East Coast (PADD 1) Reformulated Gasoline All Sales/Deliveries by Prime Supplier (Thousand Gallons per Day) | ||||||||
| Decade | Year-0 | Year-1 | Year-2 | Year-3 | Year-4 | Year-5 | Year-6 | Year-7 | Year-8 | Year-9 |
|---|---|---|---|---|---|---|---|---|---|---|
| 1990's | 4,945.8 | 48,721.6 | 48,557.9 | 49,415.3 | 49,463.9 | 47,874.9 | ||||
| 2000's | 48,092.2 | 50,035.1 | 51,884.3 | 52,179.8 | 51,953.9 | 52,458.4 | 50,676.7 | 51,811.0 | 51,478.2 | 51,477.7 |
| 2010's | 52,061.6 | 51,337.1 | 48,289.7 | 46,879.2 | 44,125.1 | 48,616.1 | 50,374.4 | 48,602.5 | 48,180.7 | 47,117.0 |
| 2020's | 39,668.7 |
| - = No Data Reported; -- = Not Applicable; NA = Not Available; W = Withheld to avoid disclosure of individual company data. |
| Release Date: 6/1/2022 |
| Next Release Date: TBD |