|
Download Data (XLS File) |
|
||||||||
|
||||||||
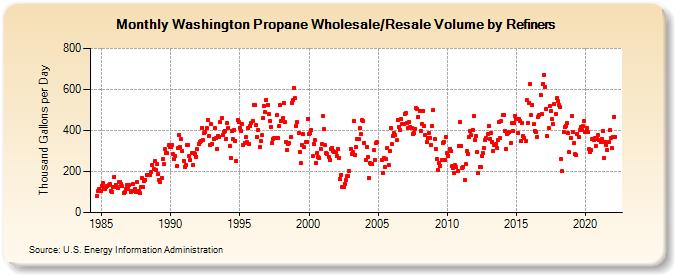
| Washington Propane Wholesale/Resale Volume by Refiners (Thousand Gallons per Day) | ||||||||
| Year | Jan | Feb | Mar | Apr | May | Jun | Jul | Aug | Sep | Oct | Nov | Dec |
|---|---|---|---|---|---|---|---|---|---|---|---|---|
| 1984 | 81.2 | 106.6 | 116.7 | 103.8 | ||||||||
| 1985 | 131.5 | 144.9 | 118.7 | 112.8 | 126.7 | 128.3 | 133.5 | 140.1 | 106.4 | 101.7 | 126.3 | 174.6 |
| 1986 | 136.1 | 126.7 | 118.5 | 148.0 | 147.8 | 139.8 | 127.2 | 97.4 | 98.1 | 115.4 | 133.9 | 113.7 |
| 1987 | 132.0 | 100.8 | 105.6 | 137.4 | 102.8 | 115.8 | 99.0 | 147.9 | 105.3 | 94.5 | 124.9 | 168.8 |
| 1988 | 122.5 | 155.9 | 159.4 | 183.7 | 182.1 | 182.3 | 185.1 | 199.0 | 234.0 | 212.2 | 249.7 | 209.8 |
| 1989 | 234.2 | 188.8 | 156.9 | 148.2 | 170.1 | 258.7 | 236.3 | 308.1 | 288.9 | 288.3 | 327.2 | 321.0 |
| 1990 | 317.7 | 330.4 | 284.3 | 260.0 | 273.7 | 224.9 | 312.8 | 376.8 | 320.1 | 357.3 | 299.2 | 253.5 |
| 1991 | 223.6 | 233.5 | 329.4 | 331.3 | 276.7 | 256.0 | 289.2 | 230.2 | 291.3 | 285.1 | 272.9 | 307.6 |
| 1992 | 332.8 | 344.3 | 348.3 | 412.4 | 352.9 | 389.5 | 394.8 | 412.0 | 449.9 | 370.7 | 329.4 | 431.1 |
| 1993 | 335.4 | 360.3 | 410.9 | 361.4 | 308.3 | 374.9 | 368.2 | 440.8 | 460.2 | 378.6 | 394.8 | 398.9 |
| 1994 | 360.8 | 436.9 | 414.4 | 325.1 | 267.1 | 397.5 | 356.3 | 402.4 | 351.0 | 253.2 | 451.4 | 439.9 |
| 1995 | 413.0 | 398.2 | 430.3 | 327.5 | 336.6 | 366.5 | 344.9 | 411.3 | 333.6 | 423.0 | 437.0 | 445.6 |
| 1996 | 524.3 | 525.3 | 425.2 | 368.9 | 402.8 | 320.6 | 347.8 | 376.2 | 458.7 | 518.7 | 488.3 | 549.1 |
| 1997 | 524.6 | 481.4 | 445.6 | 417.7 | 340.0 | 358.0 | 365.6 | 361.3 | 474.2 | 363.8 | 420.4 | 522.0 |
| 1998 | 448.3 | 459.9 | 536.3 | 439.3 | 346.1 | 306.5 | 335.6 | 336.7 | 367.2 | 534.5 | 547.4 | 609.4 |
| 1999 | 557.0 | 423.7 | 439.5 | 389.9 | 296.5 | 241.2 | 329.4 | 380.6 | 319.2 | 344.0 | 345.8 | 458.0 |
| 2000 | 383.3 | 386.8 | 401.5 | 273.4 | 333.9 | 352.2 | 242.7 | 290.9 | 272.5 | 265.0 | 310.6 | 334.3 |
| 2001 | 470.2 | 406.4 | 327.7 | 292.5 | 287.3 | 272.5 | 254.0 | 308.8 | 316.1 | 300.2 | 295.3 | 296.2 |
| 2002 | 275.2 | 310.1 | 267.2 | 162.0 | 184.6 | 123.8 | 125.5 | 141.4 | 160.4 | 176.3 | 176.1 | 200.2 |
| 2003 | 310.0 | 287.5 | 293.7 | 446.7 | 282.5 | 319.3 | 359.1 | 358.8 | 412.0 | 381.5 | 449.2 | 445.3 |
| 2004 | 339.3 | 256.6 | 320.8 | 269.7 | 170.5 | 240.4 | 234.9 | 237.7 | 302.7 | 258.1 | 339.5 | 344.9 |
| 2005 | NA | NA | NA | 256.5 | 191.8 | 264.1 | 223.5 | 262.1 | 316.1 | 230.7 | 302.3 | 413.6 |
| 2006 | 332.2 | 371.9 | 387.9 | 378.8 | 351.8 | 452.0 | 419.1 | 403.4 | 457.5 | 432.3 | 432.7 | 480.3 |
| 2007 | 482.9 | 438.2 | 410.4 | 440.5 | 417.5 | 414.4 | 384.8 | 389.6 | 406.4 | 507.4 | 506.2 | 464.6 |
| 2008 | 495.5 | 397.7 | 433.5 | 495.6 | 421.1 | 379.8 | 342.7 | 361.4 | 385.4 | 364.1 | 330.3 | 423.6 |
| 2009 | 499.1 | 357.2 | 311.6 | 260.7 | 209.4 | 242.3 | 229.0 | 256.1 | 340.2 | 345.3 | 256.7 | 368.1 |
| 2010 | 290.6 | 277.4 | 311.7 | 300.1 | 224.5 | 216.1 | 193.4 | 229.9 | 220.4 | 202.6 | 326.1 | 439.6 |
| 2011 | 324.4 | 216.0 | 223.2 | 160.4 | 237.0 | 297.7 | 286.4 | 370.1 | 396.2 | 378.3 | 404.3 | 470.1 |
| 2012 | 353.4 | 373.0 | 295.9 | 192.5 | 224.2 | 222.8 | 276.0 | 290.2 | 314.3 | 353.3 | 363.7 | 380.8 |
| 2013 | 423.8 | 360.2 | 387.6 | 345.4 | 299.0 | 328.4 | 333.8 | 317.0 | 354.5 | 440.9 | 365.5 | 444.5 |
| 2014 | 473.4 | 476.3 | 399.0 | 310.6 | 385.0 | 388.6 | 390.2 | 337.2 | 434.8 | 399.2 | 434.1 | 470.9 |
| 2015 | 457.8 | 388.1 | 455.8 | 445.5 | 348.2 | 435.6 | 374.6 | 365.1 | 349.5 | 550.2 | 436.8 | 534.3 |
| 2016 | 626.9 | 473.8 | 525.1 | 430.1 | 398.8 | 393.0 | 369.1 | 465.8 | 475.8 | 575.0 | 481.8 | 627.6 |
| 2017 | 671.0 | 611.5 | 504.3 | 371.1 | 414.3 | 521.5 | 493.5 | 453.5 | 431.6 | 527.4 | 481.3 | 556.8 |
| 2018 | 542.8 | 525.8 | 515.1 | 259.4 | 200.7 | 390.4 | 415.6 | 423.2 | 434.7 | 386.5 | 293.2 | 363.4 |
| 2019 | 468.3 | 391.9 | 339.6 | 283.3 | 281.1 | 384.9 | 369.7 | 402.0 | 417.5 | 403.0 | 421.4 | 445.6 |
| 2020 | 392.7 | 414.0 | 390.4 | 308.1 | 295.5 | 303.1 | 356.9 | 354.6 | 361.1 | 325.2 | 359.0 | 376.5 |
| 2021 | 353.5 | 345.2 | 360.3 | 398.6 | 265.2 | 345.1 | 328.8 | 304.7 | 346.1 | 400.3 | 364.1 | 315.3 |
| 2022 | 368.5 | 466.2 | 369.3 | |||||||||
| - = No Data Reported; -- = Not Applicable; NA = Not Available; W = Withheld to avoid disclosure of individual company data. |
| Release Date: 6/1/2022 |
| Next Release Date: TBD |